Trace a debt-funded acquisition from purchase price and closing equity to exit proceeds, invested capital multiple and sponsor IRR.
Leveraged buyout model
A leveraged buyout (LBO) model estimates a sponsor’s equity return on an acquisition funded with a substantial amount of debt. It links the price and funding at closing to the target’s cash generation, the debt remaining at sale and the sponsor’s proceeds. The model lets an analyst test how much leverage the business can service and whether the equity return depends on a buyer paying a higher valuation multiple. Kaplan and Strömberg, Leveraged Buyouts and Private Equity
Buy for 400, fund with 160 of equity
In a fictional buyout, entry enterprise value is USD 400 million, or 10 times EBITDA of USD 40 million. The target has no cash or existing debt at purchase. The sponsor holds all the common equity, and the example omits taxes, fees and other claims.
Sources of funds
USD millions
Uses of funds
USD millions
New acquisition debt
240
Purchase price
400
Sponsor common equity
160
Total sources
400
Total uses
400
The acquisition starts with debt of 6 times entry EBITDA. That ratio measures the debt load relative to earnings. The 10× entry multiple measures the price paid for those earnings.
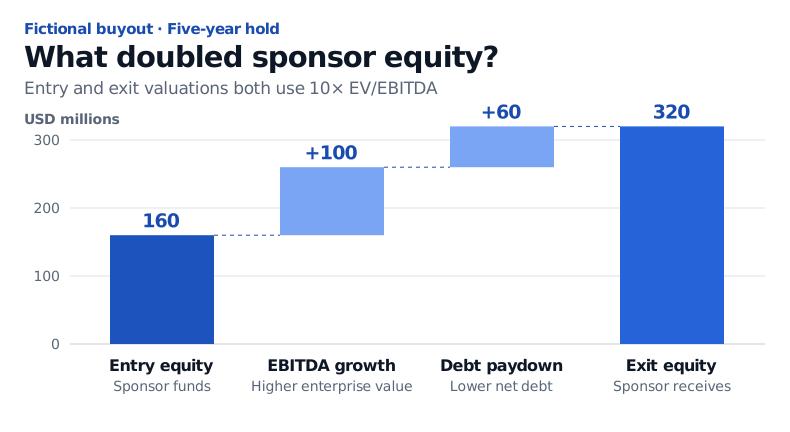
What doubled sponsor equity?
Over the hold, the company is assumed to repay USD 60 million of principal from cash generated by the business, leaving USD 180 million of net debt at sale. The company has no excess cash at exit and pays the sponsor no dividends during the hold.
At exit, EBITDA has grown to USD 50 million. A buyer paying the same 10× multiple values the business at USD 500 million. After the lender receives USD 180 million, USD 320 million goes to the sponsor. The equity gain comes from USD 100 million of higher enterprise value and USD 60 million of lower net debt. The exit multiple stayed flat.
Fictional buyout equity bridge in USD millions. Entry equity of 160 rises by 100 from EBITDA growth and by 60 from debt repayment, reaching exit equity of 320.
The floating bars separate the increase in business value from the reduction in the lender’s claim.
The two sponsor cash flows are an outflow of USD 160 million on 1 January 2027 and an inflow of USD 320 million on 1 January 2032. On this full-anniversary convention the hold is exactly five years. The multiple on invested capital (MOIC) measures how many dollars came back per dollar invested. The effective annual internal rate of return (IRR) is the discount rate that makes the two dated flows sum to zero in present value.
At an 8× exit multiple, the same USD 50 million of EBITDA supports USD 400 million of enterprise value. Keeping exit net debt at USD 180 million, the sponsor receives USD 220 million, or 1.375× invested equity. The lender’s claim is unchanged in this sensitivity, so the entire USD 100 million reduction in sale value comes out of common equity.
In a full model, build the debt schedule from cash available after working-capital needs, capital spending, cash taxes and interest. Higher floating-rate interest or weaker cash generation can slow repayment. A covenant breach or a loan maturity can force a refinancing or a cash injection before the assumed sale. Check the company’s ability to make payments along the way as well as the proceeds on the exit date. Damodaran, Anatomy of a Leveraged Buyout, Value and Leverage
The SelfMadeQuant lesson explains how buyout borrowing can affect existing bondholders through debt seniority and covenants. The preview is public and the full lesson requires membership. Credit-Sensitive Bonds