See how daily leverage and inverse targets compound, and why the same benchmark finish can produce different ETF returns.
Leveraged and inverse ETF
A leveraged exchange-traded fund (ETF) seeks to magnify a benchmark’s return. An inverse ETF seeks a negative multiple of that return, such as −1×. A fund targeting −2× is both leveraged and inverse. Most of these funds set their objective for a single trading day. The daily target describes one day’s return, so it is a poor shortcut for estimating a multi-day trade or sizing a hedge over several sessions. SEC investor bulletin on leveraged and inverse ETFs.
The prospectus specifies the benchmark, multiple and measurement window. ProShares Ultra S&P500 (SSO) seeks +2× the daily S&P 500 Index return and ProShares Short S&P500 (SH) seeks −1×, both before fees and expenses. For these funds, one day runs from one net asset value (NAV) calculation to the next. SSO summary prospectus, SH summary prospectus.
Two days, two different bases
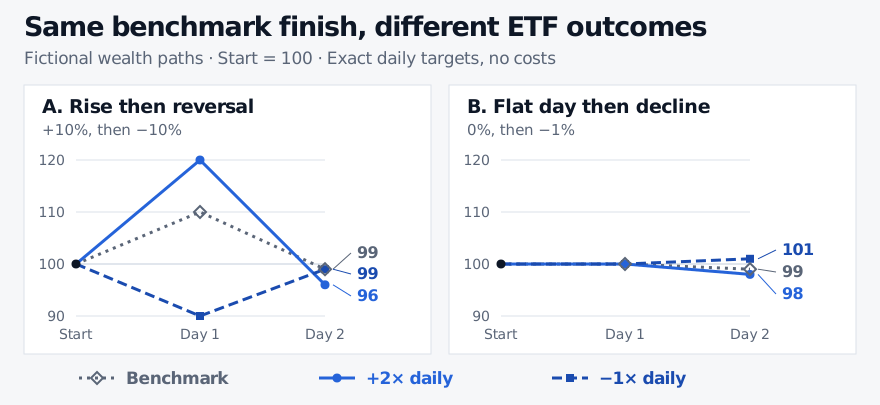
Start the benchmark and two hypothetical funds at 100. The benchmark gains 10% on day one and loses 10% on day two. Assume the funds hit their daily targets exactly, with zero fees, financing and trading costs.
The benchmark loses 1% over two days. Applying the stated multiples to that 1% loss would suggest a 2% loss for the leveraged fund and a 1% gain for the inverse fund. The ideal funds lose 4% and 1%, respectively. The +2× fund loses 20% on a larger base of 120, while the −1× fund earns 10% on a smaller base of 90. Both hit their daily targets. The SEC bulletin’s two-day illustration puts the 10% loss first and reaches the same benchmark and +2× endpoints.
Now give the benchmark a flat first day and a 1% decline on the second. It still ends at 99, but the +2× fund ends at 98 and the inverse fund ends at 101. This is what path dependence means here. The endpoint alone loses information about the daily moves. Reordering the same daily returns changes interim wealth while leaving the final product unchanged in this ideal model.
Two fictional paths start at 100 and end at benchmark wealth 99. After +10% then −10%, the ideal +2× and −1× funds end at 96 and 99. After 0% then −1%, they end at 98 and 101.
Both benchmark paths lose 1%. Exact daily targeting gives different two-day fund returns because the daily benchmark moves differ.
For a daily multiple L and daily simple benchmark returns rt, compounding gives the ideal holding-period return, assuming every daily wealth factor stays positive:
Rideal=t=1∏T(1+Lrt)−1.
The gap versus multiplying the whole-period benchmark return can go either way. With two successive 10% benchmark gains, the ideal +2× fund gains 44% while the benchmark gains 21%, so the fund exceeds the simple 42% comparison.
Resetting exposure and measuring tracking
In the ideal example, the +2× fund starts day two with 120 of net assets and targets 240 of benchmark exposure. The −1× fund starts with 90 and targets −90 of exposure. Leveraged ETF rebalancing explains how the portfolio trades restore these ratios as net assets change. Funds can use swaps or futures to take benchmark exposure. The Swaps lesson explains the equity-return and financing legs, with the full lesson available through free sign-in. SSO summary prospectus, SH summary prospectus.
To assess a fund, compare each NAV-period return with the target multiple of the specified benchmark return for that same period. Account for distributions when measuring fund performance. Operating expenses, financing and trading costs, and imperfect exposure can affect those daily differences. Compare the compounded results separately to see how much of the multi-day outcome the ideal daily rule explains. A trade executed intraday has its own return because the trade uses exchange prices and may cover only part of a NAV period. SSO summary prospectus.