Express a matrix through its eigenvectors and eigenvalues, distinguish general and orthogonal decompositions, and use separate signal and covariance examples to interpret modes correctly.
Eigenvalue decomposition
Eigenvalue decomposition, or eigendecomposition, expresses a square matrix through its eigenvectors and eigenvalues. When a matrix A has enough independent eigenvectors to form a basis, the decomposition is
A=PΛP−1.
The columns of P are eigenvectors, and the matching eigenvalues sit on the diagonal of Λ. It is the same operation described in coordinates where each component is scaled separately. For a quant, that can turn a coupled linear model into separate modes or turn correlated asset returns into uncorrelated risk factors.
The qualification enough independent eigenvectors is essential. A square matrix need not admit this decomposition. The especially useful orthogonal form for real symmetric matrices has a stronger guarantee.
What the three matrices do
Let P=[v1⋯vn] and Avi=λivi. Column by column, these eigenvalue equations give AP=PΛ. If the vectors are linearly independent, P is invertible, giving the displayed factorisation.
Read the product from right to left:
P−1x expresses the input in the eigenvector basis.
The diagonal matrixΛ scales each eigen-coordinate by its own eigenvalue.
P converts the result back to the original coordinates.
This is a change of basis, so the matrix entries change while the underlying linear operation stays the same. Keep the ordering consistent: the ith column of P must match the ith diagonal entry of Λ. Eigenvectors can be rescaled by any nonzero constant, so the displayed factors are not unique.
The symmetric case: perpendicular modes
For a real symmetric matrix, A=A⊤, the spectral theorem guarantees a complete orthonormal eigenbasis. We can write
A=QΛQ⊤,Q⊤Q=I,A=i=1∑nλiqiqi⊤.
Here the columns of the orthogonal matrix Q have unit length and are mutually perpendicular, so Q−1=Q⊤. Each term in the sum projects onto one eigen-direction and then scales that projection. A general eigenvector matrix P need not be orthogonal: replacing P−1 with P⊤ would usually give the wrong answer. Strang's §§6.2 and 6.4 develop these two cases separately.
Symmetry guarantees real eigenvalues. It does not guarantee positive eigenvalues; diag(−1,1) is symmetric too. Covariance matrices have nonnegative eigenvalues because they are positive semidefinite, an additional property.
A model that amplifies common movement
Imagine a synthetic, dimensionless two-signal stress model. One update maps a signal vector to Ax, where
A=(2112),Q=21(111−1),Λ=(3001).
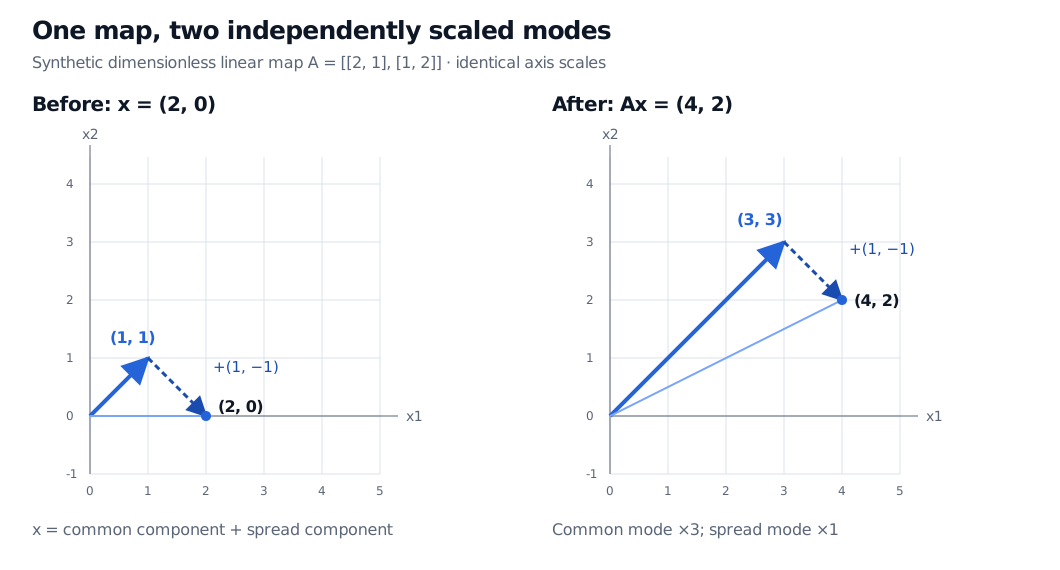
The common-movement direction (1,1)⊤ is multiplied by 3, while the spread direction (1,−1)⊤ is multiplied by 1. Direct multiplication verifies Aq1=3q1, Aq2=q2 and A=QΛQ⊤.
Start with x0=(2,0)⊤. Its decomposition is particularly transparent:
x0=(11)+(1−1),Ax0=3(11)+(1−1)=(42).
Dimensionless synthetic map A with diagonal entries 2 and off-diagonal entries 1. Input (2,0) is the sum of (1,1) and (1,-1). Output (4,2) is the sum of (3,3) and (1,-1): common movement triples and the spread is unchanged.
Original synthetic signal example, with identical dimensionless coordinate scales in both panels. The dashed arrow is the spread component translated to the tip of the common component.
For repeated updates, the adjacent factors Q⊤Q cancel:
Ak=QΛkQ⊤,xk=(3k+13k−1)(k=0,1,2,…).
Updates k
First signal
Second signal
0
2
0
1
4
2
2
10
8
3
28
26
In particular,
A3=Q(27001)Q⊤=(14131314).
The gap between the signals stays at 2, while their common level grows. That conclusion follows from this deliberately specified update rule; it is not an estimated market forecast. A starting vector entirely along the spread direction would have no growing common component.
Covariance uses the same algebra, with a different meaning
Now consider a separate hypothetical risk model for two assets' daily decimal returns:
Σ=10−4(2112).
Its eigenvectors are the same Q, but its eigenvalues are 3×10⁻⁴ and 10−4, measured in squared daily-return units. For centred returns r, the factors f=Q⊤r have covariance matrix
Cov(f)=Q⊤ΣQ=diag(3×10−4,10−4).
The factors are uncorrelated. Independence does not follow without further distributional assumptions. The common direction accounts for 3/(3+1)=75% of total asset variance, which is the interpretation used in covariance-based principal component analysis. This percentage describes variance, not expected return or predictive value.
For fixed portfolio weights w, write b=Q⊤w. Then
Var(w⊤r)=i∑λibi2.
An equal-weight holding, w=(1/2,1/2)⊤, has exposures b1=1/2 and b2=0. Its daily variance is 1.5×10⁻⁴ and daily volatility is approximately 1.225%. All its variance comes from the common factor, despite that factor explaining only 75% of the asset universe's total variance. Factor size and a particular portfolio's factor exposure answer different questions.
Do not interpret Σ3 as a three-day covariance forecast. Matrix multiplication would cube the squared-return units. Aggregating risk across days instead requires a temporal model, including assumptions about serial dependence.
Where the decomposition can mislead
A repeated eigenvalue does not automatically prevent diagonalisation. The identity matrix has repeated eigenvalues and every basis works. But
J=(1011)
has only one independent eigenvector direction: (J−I)x=0 forces x2=0. It cannot be written PΛP−1, even allowing complex coordinates. A real matrix can also have complex eigenpairs, so real diagonalisation requires a real eigenbasis. The singular value decomposition has broader existence guarantees and applies to rectangular matrices too.
Zero eigenvalues are compatible with diagonalisation; they prevent an ordinary inverse. Repeated eigenvalues permit different orthonormal bases within the same eigenspace. Even with distinct eigenvalues, each eigenvector's sign is arbitrary. In estimated risk models, nearly equal eigenvalues can make individual factor directions sensitive to small data changes. A successful factorisation establishes an algebraic representation, not the reliability or economic meaning of the estimated factors.
For a fuller risk treatment, The Spectral Theorem for Real Symmetric Matrices develops portfolio variance by factor. PCA and Factor Compression connects covariance eigenpairs to a centred returns panel and the cost of discarding modes. Both offer public previews; full lessons require membership.
Sources
Gilbert Strang, Introduction to Linear Algebra, 5th edition, §§6.2, “Diagonalizing a Matrix”; 6.4, “Symmetric Matrices”; and 12.2, “Covariance Matrices and Joint Probabilities.”