Earnings quality is how faithfully reported profit reflects a business’s underlying performance and how useful it is for forecasting future profit and cash flow. An accounting red flag is an unusual result or disclosure that deserves a closer look. In equity research, a profit increase driven by repeat sales with normal collections supports a different forecast from one driven by an asset sale, a change in an estimate or sales that are taking longer to collect. Dechow and Dichev, The Quality of Accruals and Earnings
Trace the gap from profit to cash
Under accrual accounting, a credit sale can enter revenue before the customer pays, and a cash purchase of inventory can precede the expense recognised when the goods sell. The operating section of the cash flow statement helps separate those timing differences from other reasons that profit and cash diverge. Use the same fiscal period, consolidation scope and currency for both measures. In an interim filing, a three-month income figure and a year-to-date cash figure cover different periods. For peer comparisons, check how each company classifies its cash flows. IFRS Foundation, IAS 7 overview
A fictional wholesaler reports annual net income of 80 currency units. Operating receivables rose by 30 and inventory by 10. With all other reconciliation items at zero, cash flow from operations (CFO) is
Here each change is the closing balance minus the opening balance. One transaction history consistent with those numbers is 160 in credit sales, 130 in collections, 90 in cash purchases of stock and 80 in cost of goods sold, with no other revenue, costs or taxes. On the cash side, 130 of receipts less 90 of payments gives the same CFO of 40.
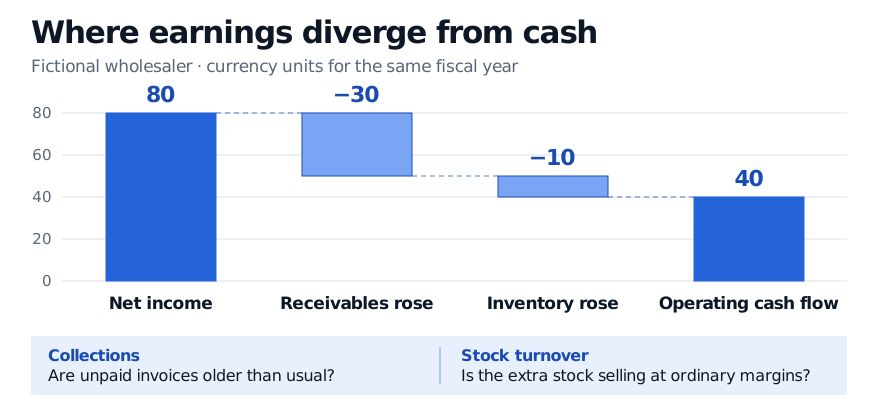
Receivables explain 30 of the 40-unit gap, so customer collections are the first follow-up.
What would explain the pattern?
| What you see | What to check next |
|---|---|
| Receivables grow faster than sales. | Compare the same fiscal quarter across years. Check whether customers took longer to pay, credit terms changed, or overdue balances and loss allowances rose. Check subsequent collections where disclosed. Unusual period-end sales warrant a closer read of returns and acceptance terms. |
| Inventory grows faster than sales or cost of sales. | Look for a planned seasonal build, slower turnover, markdowns or inventory write-downs. Check whether the extra stock sells at ordinary margins in later periods. |
| CFO looks strong despite weak collections. | Trace whether the lift came from slower supplier payments, early customer payments or a change in cash flow classification. Those changes have different implications from improved collections. |
| Reported or adjusted profit rises on an unusual item. | Separate a gain on selling an asset from ongoing margins. Compare the reported-to-adjusted reconciliation across years and look for costs excluded repeatedly, even if each charge has a different name. |
For a U.S. Form 10-K, read the cash flow statement and notes alongside Management’s Discussion and Analysis (MD&A). The liquidity discussion, unusual items and critical estimates can explain whether the change arose from normal trading, a change in assumptions or a one-off event. SEC staff guidance considers irregularly repeating operating expenses recurring when assessing non-GAAP adjustments. Regulation S-K, Item 303(b)(1)–(3), SEC staff non-GAAP interpretations, questions 100.01–100.03
Separate the screen from the conclusion
An accrual ratio can flag a large profit-to-cash gap across companies. Dechow and Dichev studied a separate question across multiple periods and found that working-capital accruals that matched realised cash flows more closely were associated with more persistent earnings in their sample. For the wholesaler, timely collections and normal stock turnover would support a timing explanation. Repeated gaps accompanied by older receivables or markdowns would weaken the case for carrying current margins and cash conversion into a forecast. Dechow and Dichev, §§2.2 and 4.3
Beneish’s original manipulation screen used changes in several financial-statement variables, including receivables relative to sales. He identified ordinary changes in credit policy as another reason receivables can rise. A single ratio or the fact that a filing was flagged cannot establish persistent earnings quality, an accounting misstatement or intent. The U.S. audit standard AS 2401 recognises that unexpected analytical results can arise from changes in the business. It identifies intent as the distinction between fraud and error. Beneish, The Detection of Earnings Manipulation, PCAOB AS 2401, paragraphs .05 and .11
The SelfMadeQuant capstone uses a scaled earnings-to-cash gap alongside other filing measures to rank reports for review. It also shows how a separate filing-event feed can surface cases the numerical screen misses. Financial Filing Change and Deterioration Monitor (full report for members)
Sources
- IFRS Foundation, IAS 7 Statement of Cash Flows overview
- Dechow and Dichev, The Quality of Accruals and Earnings: The Role of Accrual Estimation Errors, authors’ working paper
- Beneish, The Detection of Earnings Manipulation, author’s manuscript
- Regulation S-K, Item 303, Management’s Discussion and Analysis
- SEC Division of Corporation Finance, Non-GAAP Financial Measures interpretations
- PCAOB, AS 2401, Consideration of Fraud in a Financial Statement Audit