An accrual ratio measures the accrual component of earnings relative to a measure of company size. The cash-flow-based operating accrual ratio used here compares net income with cash flow from operations (CFO) in the cash flow statement and scales the difference by average total assets. Equity researchers use it to compare how far reported profits and operating cash diverge across firms and to test whether that gap helps forecast future earnings. Hafzalla, Lundholm and Van Winkle, Percent Accruals
Equal earnings, different cash
Use consolidated net income and CFO for the same fiscal period, in the same currency and units. Average total assets is the mean of total assets at the beginning and end of that period.
Fictional Firm A earns 120 and reports CFO of 90. Its total assets start at 280 and end at 320. The earnings-to-cash gap is 30 and average assets are 300, giving . This means earnings exceeded CFO by 10% of average assets. A CFO-to-net-income measure of cash conversion uses earnings as its denominator.
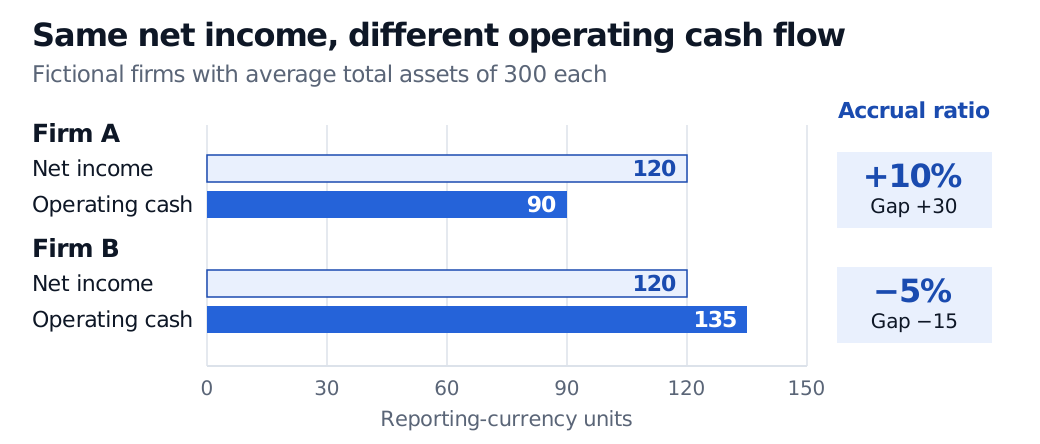
Identical profits can conceal opposite earnings-to-cash gaps. The ratio scales each signed gap by the same asset base.
Under accrual accounting, a credit sale can raise net income before the customer pays. Collection of older receivables can lift this year's CFO with no corresponding current-year revenue. An operating cash payment for a restructuring charge recognised in an earlier year can also lift the ratio by depressing CFO. A noncash write-down can push the ratio the other way by reducing earnings. Check the reconciliation and the notes before attributing the gap to persistent operating performance. Dechow and Ge, The Role of Special Items
Check which formula a study uses
- Sloan’s original balance-sheet estimate uses the change in noncash current assets minus the change in current liabilities excluding short-term debt and income taxes payable, then subtracts depreciation and amortisation. It scales that amount by average total assets. Acquisitions and currency translation can move balance-sheet balances without a corresponding operating cash movement. Sloan (1996), equations 1–3, Hribar and Collins (2002)
- Net operating asset variants scale by average net operating assets, meaning operating assets less operating liabilities. One balance-sheet variant uses the change in net operating assets as its numerator. A cash-flow variant subtracts both operating and investing cash flow from net income, using both flows with their reported signs. Those choices can change how firms rank. CFA Society Chicago, Earnings Quality – Accrual Ratios
Sloan found that the accrual component was less persistent than the cash component in his historical sample. He also found lower subsequent benchmark-adjusted returns for the highest-accrual portfolio than for the lowest-accrual portfolio, a result known as the accruals anomaly. A new study needs to specify the earnings line, cash-flow definition and scaling base before ranking firms. Compare firms with similar operating cycles and cash-flow classifications, and record one-off adjustments so the reported and adjusted signals can be compared. Sloan (1996), Tables 3 and 6, Dechow and Ge (2006)
When the ratio enters a backtest
Date the ratio by when the last required input became usable through your data source. A fiscal year-end identifies the period measured. A release or filing supplies the figures, and a later restatement changes the input only from the time the revised version becomes usable. Keep the source filing and version for each input to avoid look-ahead bias. The SEC’s EDGAR APIs expose submission histories and aggregate facts across filings, so a historical join still needs to select the eligible version. SEC EDGAR API documentation
The SelfMadeQuant lesson works through how to date a signal when its inputs arrive at different times. A preview is public and the full lesson requires membership. Observation, Event and Availability Timestamps