A cash flow statement shows how a company’s cash and cash equivalents changed over a reporting period. It groups cash receipts and payments into operating, investing and financing activities and reconciles the opening and closing balances. For equity and credit analysis, it shows whether a rising cash balance came from the business itself, from selling assets or from raising capital. The income statement measures profit over the same period and can recognise sales before customers pay. IFRS Foundation, IAS 7 overview
From opening cash to closing cash
Cash equivalents are short-term, highly liquid holdings that can be converted into a known amount of cash with little risk of a change in value. Moving money between a bank account and a holding that already qualifies as a cash equivalent leaves their combined balance unchanged. Under U.S. GAAP, the statement’s opening and closing totals also include amounts generally described as restricted cash or restricted cash equivalents. If those amounts sit on different balance-sheet lines, look for the reconciliation on the statement or in the notes. IAS 7, paragraphs 6–9 and 45–46, FASB ASU 2016-18, amendments to Topic 230
| Activity | What it captures in a typical non-financial company |
|---|---|
| Operating (CFO) | Collections from customers and payments to employees and suppliers |
| Investing (CFI) | Purchases and sales of long-lived assets, such as machinery |
| Financing (CFF) | Cash raised by borrowing or issuing shares, and cash used to repay principal or buy back shares |
Suppose a fictional company opens the year with 100 in cash and cash equivalents, measured in reporting-currency units. Operating cash flow is +80, investing is −45 and financing is +15. Those three sections add to +50. Exchange rate movements reduce the reporting-currency value of cash held in foreign currency by 2, so the total increase is 48 and closing cash is 148.
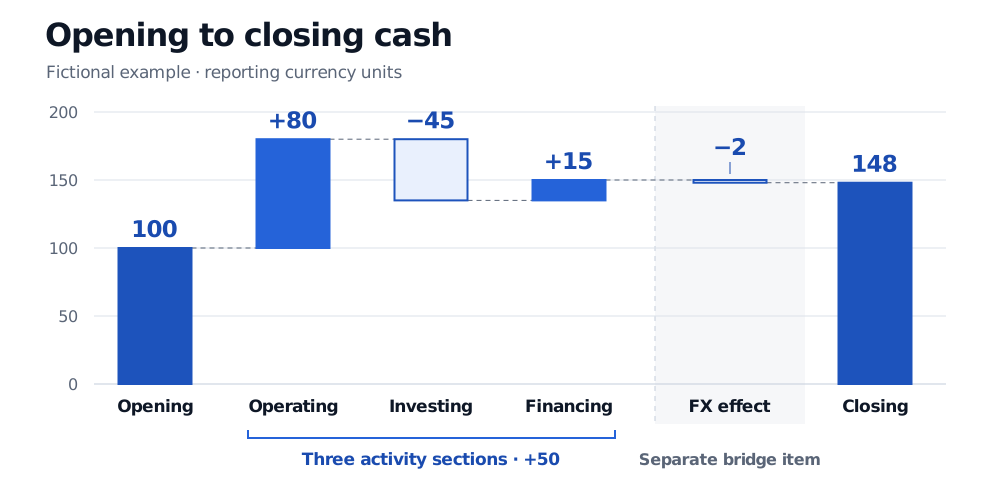
The bars reconcile balances in statement order. The three activity sections contribute +50 before the separate currency translation effect.
The foreign exchange (FX) line bridges balances translated at different exchange rates. A customer payment in foreign currency is still an operating receipt in this example. An exchange rate movement on cash already held changes the reported balance without a payment. A debt-to-equity conversion likewise moves no cash, so it belongs in the separate non-cash disclosures. Balance-sheet differences alone can mix cash transactions with changes such as these. IAS 7, paragraphs 25–28 and 43–46, FASB ASU 2016-18, amendments to Topic 830
Two ways to show operating cash flow
The direct method lists major classes of operating receipts and payments. The indirect method reconciles an earnings figure to the same net operating cash flow. It adjusts for timing differences, reverses non-cash items such as depreciation included in the starting profit and removes items whose cash effects belong in investing or financing. For example, the gain on selling a machine may enter the starting earnings figure. If it does, the indirect bridge removes the gain from operating cash flow and the investing section shows the cash proceeds. IAS 7, paragraphs 14 and 18–20
Take a service delivered in March for 100 that costs 70 to provide. The company pays the supplier in April and collects from the customer in May. With zero opening receivables and payables and no other transactions or taxes, the direct method shows zero March receipts and payments. Under the indirect method, March profit is 30. Subtract the 100 increase in receivables and add the 70 increase in payables to get the same zero operating cash flow. April then shows −70 of operating cash flow and May shows +100, with zero profit in both months. This is the accrual timing an earnings-to-cash bridge makes visible.
Reporting rules can move a line
- U.S. GAAP. For a business entity, ordinary cash interest received or paid and dividends received as investment income generally enter operating cash flow. Dividends paid to owners go in financing. A business using the direct method also supplies a reconciliation from net income to operating cash flow. FASB ASU 2016-15, Topic 230 classification, FASB ASU 2016-14, Topic 230 reconciliation
- IFRS before applying IFRS 18. IAS 7 permits interest paid and dividends paid in operating or financing, and interest and dividends received in operating or investing, with classifications applied consistently from period to period. IAS 7, paragraphs 31–34
- IFRS when applying IFRS 18. The indirect method starts at operating profit or loss. Dividends paid go in financing. For entities without investing in assets or providing financing to customers as a main business activity, interest paid goes in financing and interest and dividends received go in investing. Entities with one of those main activities place each of those three cash flow types in a single section, using rules tied to where the corresponding income or expense appears in profit or loss. IFRS 18 applies to annual periods beginning on or after 1 January 2027, with early application permitted. IFRS 18 effective date, IASB Effects Analysis, §2.5, table 4
Moving an interest payment from operating to financing increases reported CFO by the amount of that payment and leaves the total change in cash unchanged. When using financial statement data to compare CFO across firms or periods, check the reporting framework, policy and period covered. Then inspect the operating bridge. For example, a CFO increase driven by delaying payments to suppliers has a different implication for the next period than one driven by collecting more from customers.
The SelfMadeQuant capstone uses the difference between year-to-date net income and operating cash flow as one input to a filing deterioration screen. The report shows how that input is calculated from filings. Financial Filing Change and Deterioration Monitor (full report for members)
Sources
- IFRS Foundation, IAS 7 Statement of Cash Flows, 2024 issued text
- IFRS Foundation, IAS 7 overview and amendment history
- IFRS Foundation, IFRS 18 Presentation and Disclosure in Financial Statements
- IASB, IFRS 18 Effects Analysis, April 2024, §2.5 and table 4
- FASB ASU 2016-14, amendments to Topic 230 including the direct-method reconciliation
- FASB ASU 2016-15, amendments to Topic 230 cash flow classification
- FASB ASU 2016-18, restricted cash and foreign currency reconciliation amendments