An income statement, also called a statement of profit or loss, reports the income and expenses a company recognises over a period and the profit or loss they produce. For an equity or credit analyst, the subtotals show where profitability changed. Sales can hold up while the cost of making the product rises, or operating profit can hold up while higher interest expense cuts net income. SEC, Beginners’ Guide to Financial Statements, “Income Statements”
Follow the deductions
A fictional manufacturer reports USD 300 million of revenue for one quarter. This simplified statement groups costs by function, separating the cost of goods sold from expenses such as selling and administration. Assume no other profit or loss items and no other comprehensive income. Grouping expenses by what they are, such as wages or depreciation, can produce a different layout. IAS 1, paragraphs 99–105
- Gross profit is 120 million. Subtract 180 million for the goods sold during the quarter.
- Operating profit is 50 million. Subtract a further 70 million of operating expenses. These are separate from costs already included in cost of goods sold.
- Pretax profit is 40 million. Net interest expense of 10 million is the only item between operating and pretax profit in this example.
- Net income is 32 million. Subtract 8 million of income tax expense.
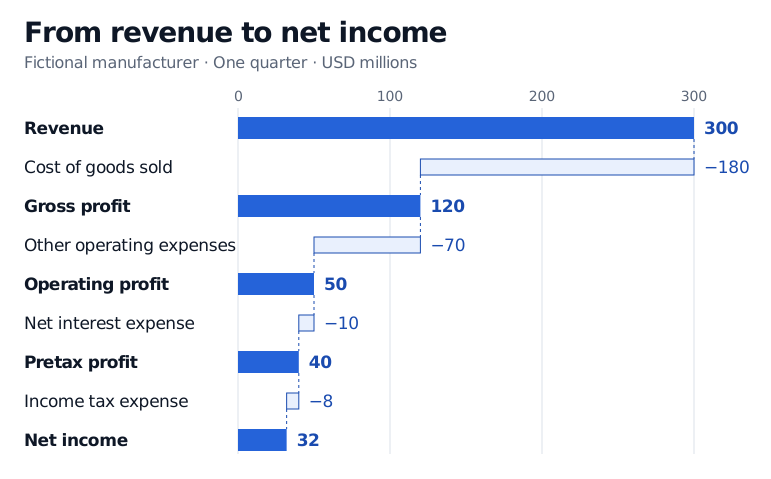
Solid bars show the amounts at each subtotal. Outlined bars show how much each expense takes out of the preceding amount.
Dividing each profit measure by the same revenue gives a gross margin of 40%, an operating margin of 16.7% and a net margin of 10.7%. Operating margin, for example, is
If net margin falls and operating margin is steady, start with the lines below operating profit. A fall in gross margin points to sales prices, product mix or the costs assigned to goods sold. Those movements locate the change in the statement. The notes and management’s discussion can help explain what drove it. In a model using financial statement data, check the period, units and subtotal definition against the filing before comparing margins across companies. SEC, “Read the Footnotes,” “Read the MD&A” and “Financial Statement Ratios and Calculations”
The SelfMadeQuant filing monitor shows how to reconcile reported sales and profit to the printed statement and use changes in gross and operating margins to prioritise filings for review. Financial Filing Change and Deterioration Monitor (full report for members)
Profit, comprehensive income and cash
Other comprehensive income (OCI) contains income and expense items that applicable standards put outside profit or loss. Total comprehensive income combines net income and OCI. A filing can show the two in separate sections of one statement or present profit or loss in a separate statement. IAS 1, paragraphs 7, 10A and 81A
Accrual accounting can recognise a credit sale in the quarter the company transfers control of the goods, as explained in revenue recognition. The customer may pay in the next quarter, when the receipt appears in the cash flow statement. The manufacturer’s 32 million therefore measures its accounting profit. To see whether the company generated cash, read its operating cash flows for the same quarter. IAS 1, paragraphs 27–28 · IFRS 15, public overview · SEC, “Cash Flow Statements”
Reading IFRS reports across the transition
For annual periods beginning in 2026, IAS 1 still applies to IFRS reporters that have yet to adopt IFRS 18. IFRS 18 replaces IAS 1 for annual periods beginning on or after 1 January 2027 and permits earlier application. It defines operating profit or loss and generally requires a second subtotal, profit or loss before financing and income taxes, which includes the investing category. The first annual IFRS 18 report reconciles the immediately preceding year’s profit-or-loss lines to the amounts previously presented under IAS 1. Use that reconciliation when a subtotal changes across the transition. IFRS 18, paragraphs 69–74 and Appendix C