Capital-structure arbitrage is a relative-value strategy that trades related claims on one issuer—such as equity, bonds and credit default swaps—against a model of how they should be priced together. Its practical purpose is to isolate a disagreement between markets while hedging some common business risk. Despite its name, it is generally a risky convergence trade, not arbitrage with a guaranteed profit.
A structural credit risk model supplies one bridge: shareholders and creditors have different claims on the same business assets. A low stock price and a wide credit spread can both reflect deterioration. A pricing discrepancy is the part left unexplained after accounting for the different claims—not the mere fact that one price rises while another falls.
A balance sheet that can be priced
Consider a fictional firm with assets and one zero-coupon debt payment of face amount , due in year. Amounts are USD million. Assume constant annual asset volatility , a continuously compounded risk-free rate , no payouts or new debt, no bankruptcy costs, frictionless trading and continuous lognormal asset dynamics. Default is assessed only at maturity; creditors then receive and equity receives .
Under these assumptions, Merton's valuation treats equity as a call on firm assets:
Here is total equity value, is debt market value, and is the standard normal cumulative distribution function. The inputs give:
| Model output | Value |
|---|---|
| 1.137574 | |
| 0.887574 | |
| Equity | USD 24.147190 million |
| Debt | USD 75.852810 million |
| Promised continuously compounded debt spread | 232.319 basis points per year |
The last row is . It is a promised-yield spread based on receiving face value, not an expected return, a physical default probability or a fair CDS premium. These are internally consistent model prices; no observed mispricing has been stipulated.
For the payoff foundation, the Options primer explains calls, puts and payoff versus profit. Its public page previews the lesson; the full topic requires a free signed-in account.
What the equity hedge actually cancels
Differentiate the model values with respect to assets, holding the other inputs fixed:
Suppose a trader judges debt cheap relative to equity. A candidate position is long debt and short equity. For a position in the firm's entire debt claim, the local model hedge is
That means shorting 14.6328% of total equity, worth USD 3.533405 million at these model values. It does not mean shorting 0.146328 individual shares or 14.6328% of the bond's market value. Scale both legs proportionally for a smaller position. Cash and financing must also be included in an actual portfolio's profit and loss.
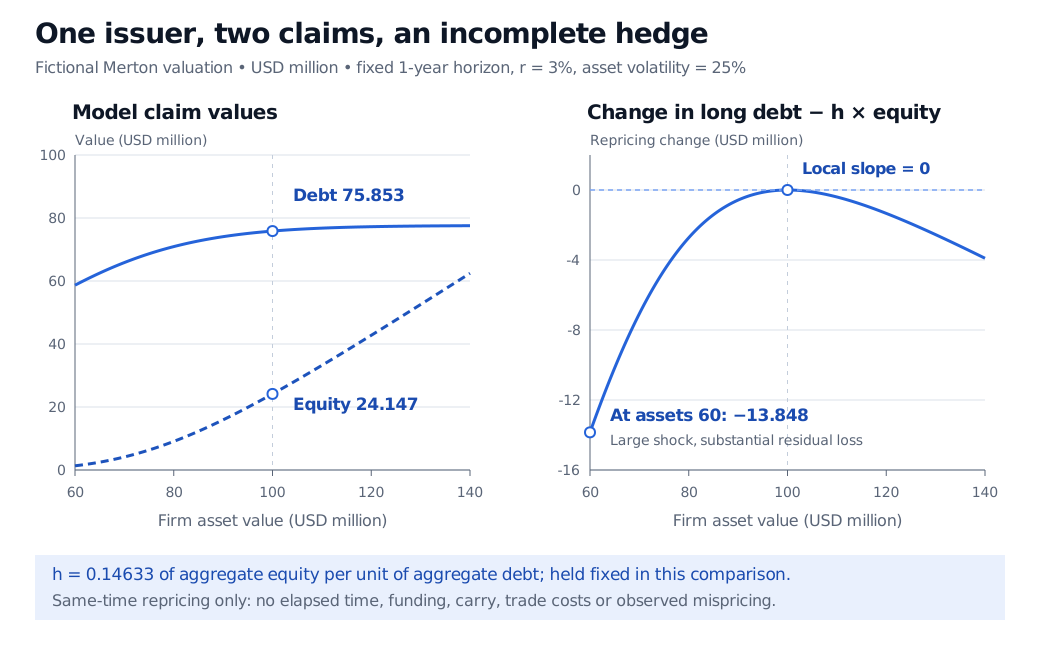
Original fictional same-time repricing. Solid blue denotes debt on the left and the combined position's value change on the right; dashed blue denotes equity. The hedge stays fixed at its initial value. The 1-year horizon, rate and volatility remain unchanged; financing, carry and trading costs are excluded.
The curve has zero slope at assets of 100, not a flat payoff everywhere. Repricing to assets of 60 leaves a loss of USD 13.848186 million after the equity hedge. This is a frozen-input shock comparison, not a simulated path or a default settlement. Delta hedging addresses local exposure; curvature and changing inputs survive.
Debt and protection have opposite trade directions
In the usual structural relationship, stronger assets raise equity and risky debt values while reducing the value of existing CDS protection. The indicative hedged directions are therefore:
| Relative-value view | Credit leg | Equity hedge |
|---|---|---|
| Debt cheap / credit spread unusually wide relative to model | Buy debt, or sell CDS protection | Short equity |
| Debt rich / credit spread unusually tight relative to model | Short debt, or buy CDS protection | Buy equity |
These are alternative implementations, not interchangeable contracts. The hedge above belongs to the specified zero-coupon debt; CDS requires its own contract valuation and sensitivity. Yu's original strategy analysis, §2.2, describes an equity-hedged CDS convergence trade and how parameter errors can create a false signal. A discrepancy alone does not identify which market is wrong or establish that it will close.
Where the residual risk lives
Model and capital-stack risk. Asset value and asset volatility must usually be inferred. Stale liabilities, changing leverage, coupons, covenants and different seniorities alter the mapping. Debt issued by a holding company need not have the same access to operating assets as an operating-company obligation. A spread difference can compensate for these rights or for liquidity, rather than reveal mispricing. A useful equity sensitivity also need not imply an accurate price level: that distinction is central to Schaefer and Strebulaev's research.
Default and recovery risk. In the toy model, assets of 60 at maturity pay creditors 60 against face 80: 75% recovery and zero equity. Recovery follows the asset outcome; no fixed recovery rate was imposed. Actual CDS credit events, deliverable obligations, settlement and recovery assumptions must match the claim being hedged. A short equity position's finite gain need not cover a creditor's or protection seller's loss. Jump risk can move both legs before rebalancing is possible.
Funding and exit risk. Borrow costs, recalls and dividends affect equity shorts; bond financing and CDS collateral consume cash. Rate and volatility changes introduce further exposure. A widening discrepancy can cause margin demands or force liquidation before convergence. Yu's analysis explicitly examines this failure mechanism. Funding liquidity risk and model risk remain part of the position even when its starting delta is zero.
Sources
- Robert C. Merton, “On the Pricing of Corporate Debt: The Risk Structure of Interest Rates”, Journal of Finance 29(2), 1974, §§II–III: assumptions, equity-as-call valuation and risky discount-bond spread.
- Fan Yu, “How Profitable Is Capital Structure Arbitrage?”, working-paper version dated 3 June 2005, §§1–2.2: debt–equity/CDS convergence, trade direction, hedge construction and implementation risk. This is the dated research draft, not current CDS contract documentation.
- Stephen M. Schaefer and Ilya A. Strebulaev, “Structural Models of Credit Risk Are Useful: Evidence from Hedge Ratios on Corporate Bonds”, Journal of Financial Economics 90(1), 2008; Stanford's author-publication abstract distinguishes hedge-ratio performance from price-level performance.