A barbell bond portfolio splits its holdings between short and long maturities. A bullet bond portfolio clusters its holdings near one target maturity. You can size either portfolio to the same duration and get the same first-order response to a parallel move in the yield curve. Where you put that duration determines what happens when one part of the curve moves on its own. CFA Institute, Yield Curve Strategies
Match the duration, then move the curve
Suppose two portfolios cost the same today. The barbell puts half its market value in a two-year zero-coupon bond and half in a ten-year zero. The bullet puts all its value in a six-year zero. Consider an instantaneous change in continuously compounded spot rates. At maturity , a rate change of in decimal units multiplies that bond's current price by . For example, 100 bp is a change of .
For a parallel shift, evaluate the first and second derivatives of portfolio value at the starting curve and divide by initial value. This gives minus duration and price convexity, respectively. The first derivative weights each maturity by , and the second by .
| Portfolio | Duration (years) | Price convexity (years²) |
|---|---|---|
| Barbell | ||
| Bullet |
The two maturities in the barbell sit equally far from six years. The offsets cancel in duration, but their squares add to convexity. Exact repricing gives the barbell an edge of 7.54 bp of starting value if all three rates rise by 100 bp, and 8.50 bp if they all fall by 100 bp. Both portfolios lose on the rise and gain on the fall. Tuckman, chapter 6
Now move the two wings (two and ten years) up 25 bp and the belly (six years) down 25 bp. The spread between the ten-year and two-year rates stays fixed, while the belly falls relative to both wings. In this yield curve butterfly move, the bullet leads by about 3.00 percentage points.
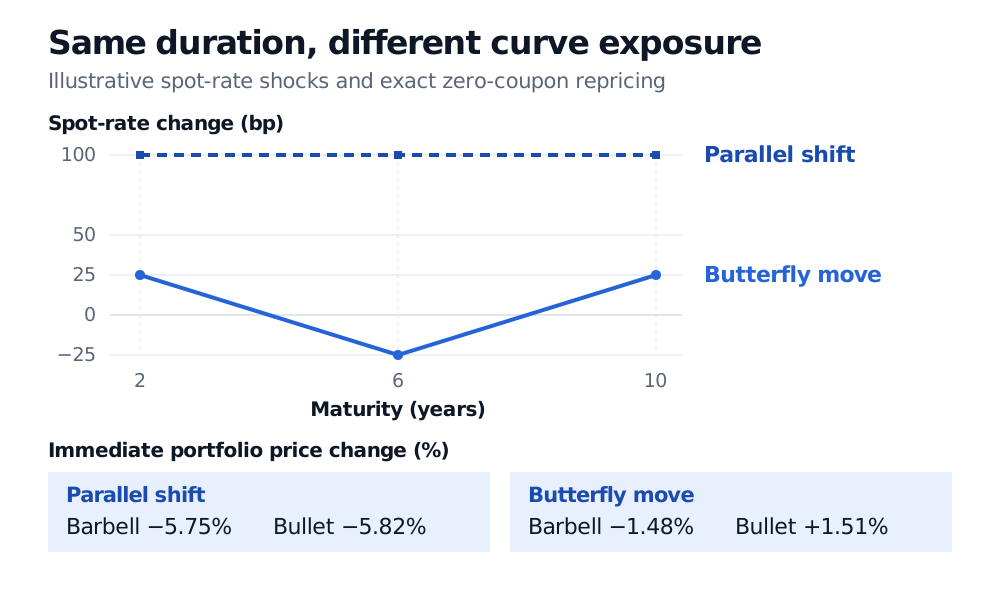
Illustrative spot-rate shocks and exact immediate price changes from the same initial market value. Lines connect the three shocked maturities.
Find the risk by maturity
Bump the two-, six- and ten-year spot rates one at a time. The barbell has key-rate durations of 1, 0 and 5 years at those nodes. The bullet has 0, 6 and 0. The ten-year leg accounts for five of the barbell's six years of duration despite holding only half its initial value. A long-barbell, short-bullet butterfly trade sized as in the example cancels first-order parallel exposure and keeps these opposing exposures to the wings and belly. Coupon payments can spread exposure across additional maturities. CFA Institute, Yield Curve Strategies
The Key Rate Exposures lesson works through how separate short- and long-end yield shocks change the dollar value of a barbell and a bullet. The preview is public and the full lesson requires membership.
Cash-flow timing matters when the portfolio funds a liability. A six-year zero with the right face value pays the bill on its due date. With the barbell, the two-year proceeds arrive early and the ten-year principal arrives late. Funding the bill can require reinvesting the short leg and selling some of the long leg at year six, which exposes the plan to reinvestment risk and the sale price of the long bond.
Compare yield at the price you pay
Equal starting cost fixes the amount invested. Each portfolio's cash-flow yield depends on the future payments that amount buys. A barbell may offer a lower yield in exchange for more convexity. For example, if the six-year spot yield exceeds both wing yields, the bullet's yield is higher because the barbell's single cash-flow discount rate lies between the two wing yields. The instant shocks in the chart isolate repricing. Over time, carry and roll-down also affect the comparison. Tuckman, chapter 10, CFA Institute, Yield Curve Strategies
Sources
- CFA Institute, Yield Curve Strategies, 2026 Level III refresher reading summary.
- Bruce Tuckman, Fixed Income Securities: Tools for Today's Markets, 2nd ed., Wiley, 2002. Chapter 6 covers the barbell versus the bullet, chapter 7 covers key-rate exposure, and chapter 10 covers the effect of convexity on yield.