A three-statement financial model links the income statement, balance sheet and cash flow statement in a single forecast. The same assumptions determine how much the business earns, what it owns and owes at period end, and how much cash it has left. An analyst can hold sales and margins fixed, lengthen customer payment terms and see whether the business needs more funding before accounting for the cost of raising it. ICAEW, Fundamentals of 3-Way Financial Modelling
One sale through all three statements
A fictional company starts the month with 100 in cash and 100 in contributed equity, with no other balances. It delivers a service for 50 on credit, collects nothing by month end, and incurs and pays 30 in operating expenses. Under accrual accounting, the sale belongs in the month the service is delivered. There are no taxes, distributions or other movements. Amounts are in reporting-currency units.
| Event | Debit | Credit |
|---|---|---|
| Recognise the credit sale | Receivables 50 | Revenue 50 |
| Incur and pay the expense | Operating expenses 30 | Cash 30 |
The income statement shows net income of 20. The receivables schedule carries 50 into the closing balance sheet because the invoice is unpaid. The cash flow statement's indirect bridge starts from profit and subtracts the increase in receivables. The cash ledger gives the same operating cash flow (CFO) directly. SEC, Beginners’ Guide to Financial Statements
Cash flows from investing and financing are both zero, so closing cash is 70. The balance sheet takes that cash figure from the cash flow statement and the 50 in receivables from the receivables schedule. Net income increases retained earnings by 20, so closing equity is the 100 originally contributed plus 20 of retained profit. Assets of equal liabilities plus equity of .
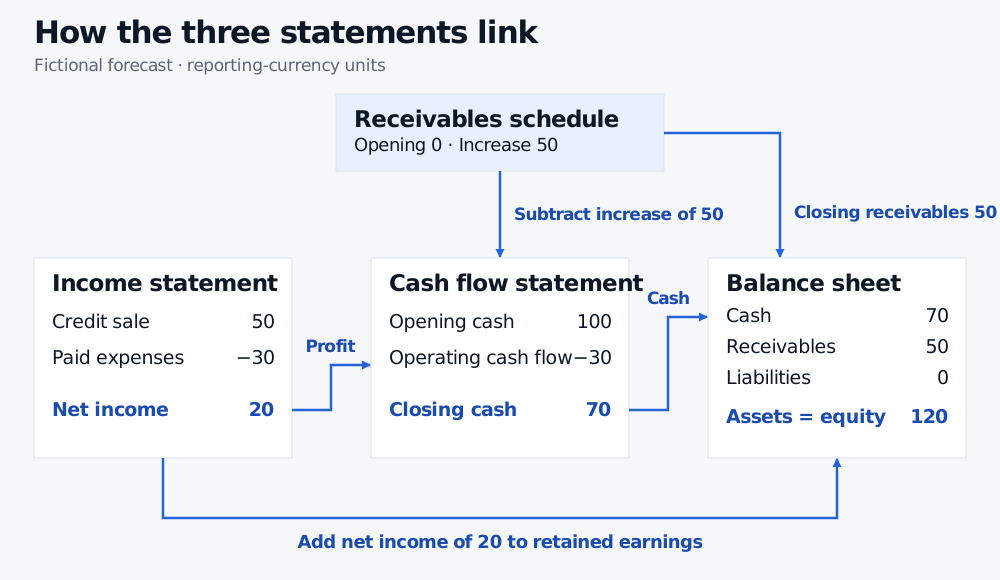
The receivables schedule supplies a change to the cash flow statement and a closing balance to the balance sheet.
Schedules carry the forecast forward
Start with the latest actual balance sheet. In each forecast period, a schedule computes movements from operating or financing assumptions and rolls the opening balance forward to a closing balance. Link each closing balance to the balance sheet and the next period’s opening balance. Calculate each movement once and link it wherever it belongs. ICAEW, Financial Modelling Code, pp. 6 and 9
| Schedule | Simple rollforward | Where the movements go |
|---|---|---|
| Receivables | Opening receivables + credit sales − collections | Recognised sales enter revenue. Collections drive operating cash receipts. Under the indirect method, subtract the increase in operating receivables in this simple case. |
| Fixed assets | Opening net fixed assets + additions − depreciation, assuming no disposals | Depreciation reduces earnings. Add it back in the indirect bridge if the starting profit includes it. Cash paid for new fixed assets appears in investing cash flow. |
| Debt | Opening debt + drawdowns − principal repayments, assuming no other movements | Drawdowns and principal repayments enter financing cash flow. The interest expense calculated from the debt schedule feeds the income statement. |
Track inventory and operating payables the same way as receivables. In a simple operating bridge, an increase in inventory reduces CFO, while an increase in operating payables raises it. In a model with acquisitions, currency effects or non-cash financing, separate those movements before using balance changes to infer cash flows. The cash flow statement must bridge the same cash and cash-equivalent balances as the balance sheet. IFRS Foundation, IAS 7 Statement of Cash Flows
Checks that catch broken links
- Balance every forecast period. Subtract liabilities and equity from assets. The residual should be zero within the model’s rounding tolerance. Calculate closing cash from cash movements and retained earnings from its own rollforward, including dividends declared. An entry chosen just to erase the residual defeats the check. ICAEW and RSM, Financial Modelling Best Practice Guideline, §5.7
- Change one driver and predict the signs. If the customer pays the full 50 before month end, closing receivables fall to zero and cash rises to 120, while profit stays at 20 and assets still equal equity. The balance check alone can miss a forecast that omits both sides of a transaction. Testing a change in collections checks whether the model responds to the payment assumption. ICAEW, Financial Modelling Code, pp. 12 and 14
- Trace funding and interest. A credit-line draw can depend on a cash shortfall that already includes current-period interest paid. If interest is based on closing debt, that draw changes the interest that created the shortfall. If all principal movements occur at period end, calculate the period’s interest on opening debt. When draw timing matters, solve the dependency explicitly and check the result against both the interest calculation and the credit limit. ICAEW, Financial Modelling Code, p. 18