For a response , candidate predictor and control , write
A candidate factor beyond the market
Consider a fictional population of monthly observations: is a fund's excess return, a candidate factor return and the market excess return. Stipulate the jointly valid population correlations
These are illustrative population inputs, not estimates from a market dataset. For one control, the residual formula gives
The numerator removes the covariance associated with the linear projection on . The denominator accounts for the smaller variance of the residualised . There is no corresponding shrinkage of in this denominator.
By contrast, partial correlation residualises both and on the same control. Its value is
The larger number uses a different reference variance. It does not represent a second improvement in the fit.
The square is an increment in R-squared
For nested linear projections of with an intercept, adding the single predictor to controls gives
Why does this work? The component is orthogonal to the existing predictor space. Its extra fitted component therefore contributes an additional, orthogonal piece of explained variation. Dividing that increment by the total variation in gives its squared correlation with .
In the fictional population:
| Quantity | Value | Denominator |
|---|---|---|
| Market-only | Total variance | |
| Full with market and candidate factor | Total variance | |
| Squared semipartial correlation | Total variance | |
| Squared partial correlation | variance remaining after market |
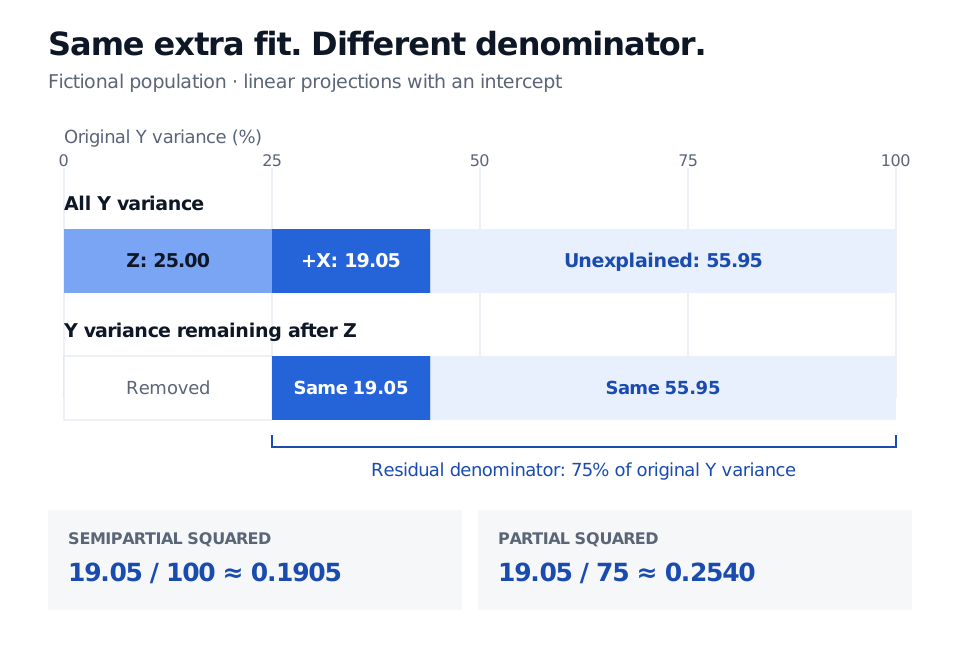
Read the direction and the model
Residualising instead gives in this example, rather than . State which variable was adjusted. Squaring also discards the sign: reversing the sign of the candidate factor reverses its semipartial correlation while leaving the increment in unchanged.
A zero semipartial correlation does not exclude nonlinear dependence. Nor does residualising on a market factor identify a causal effect or establish performance on future observations. In a sample, the raw in-sample increment cannot be negative, even for a useless extra predictor. Use separate inference and dated validation to assess sampling noise and forecasting usefulness.
Correlations require finite, nonzero variances; the residualised side must also have nonzero variance. Arbitrarily chosen pairwise correlations may fail to form a positive semidefinite correlation matrix. Exact linear redundancy makes the residual correlation undefined, rather than zero.
Sources
- Philip B. Ender, UCLA: Partial and Semipartial Correlation — definition through removing controls from predictors only.
- MRC Cognition and Brain Sciences Unit: Computing the semi-partial coefficient for a predictor — signed square root of the difference in model R-squared values.
- Algina, Keselman and Penfield (2008): Note on a Confidence Interval for the Squared Semipartial Correlation Coefficient — the original paper's abstract defines the squared coefficient as incremental explained variance; the full paper is access restricted.