A public market equivalent (PME) compares a private fund’s performance with a public benchmark using the fund’s actual capital call and distribution dates. It asks what the investor would have earned by putting the same money to work in public markets at the same times. A fund’s internal rate of return reflects those cash flows, while a headline index return reflects continuous exposure over the quoted period. The comparison can change if most of the fund’s capital was called after a market rally. Kaplan and Schoar (2005), §II.A
Put every cash flow on the same date
The Kaplan–Schoar variant (KS-PME) divides the benchmark-adjusted value the investor received by the benchmark-adjusted value they paid in. Use positive amounts for both contributions and distributions , and let be the benchmark’s total-return index level on each cash-flow date. At cutoff , an amount dated is carried forward by the factor . Add the investor’s remaining net asset value, , once at the cutoff.
A ratio above 1 means the fund beat the selected benchmark on this basis. Below 1 means it lagged, and 1 is parity. Moving both sides to the cutoff gives the same ratio as discounting both sides back to the start with the index. In contrast, total value to paid-in capital (TVPI) adds up the same dollar amounts without adjusting for when they occurred. Gredil, Griffiths and Stucke (2023), §§2.1.2 and 2.2
One call, two outcomes
Suppose an investor pays USD 100 into a fictional fund on 31 December 2023, when the USD total-return index is at 100. On 31 December 2025 the fund pays out USD 132 and liquidates, leaving zero NAV. The index level is 120. There are no other flows. Investing the contribution in the index would have turned USD 100 into USD 120. The final fund distribution is already at the cutoff, so its adjustment factor is 1.
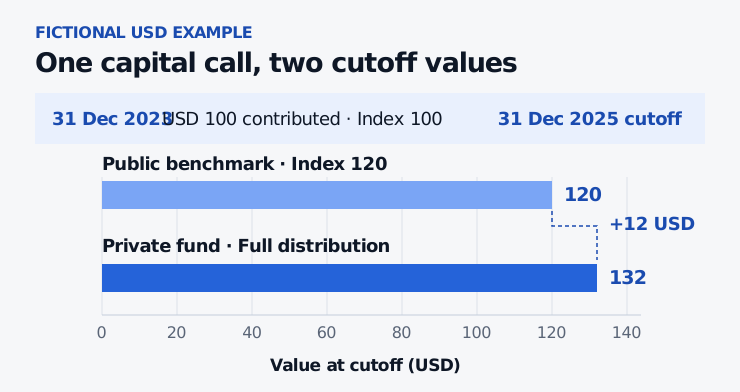
Fictional USD example. The cutoff values share a common baseline. The gap is measured relative to the USD 120 benchmark outcome.
The investor received 10% more wealth than the benchmark alternative over the two-year window. With these two flows exactly two calendar years apart, the equivalent annual relative return is effective annually. With interim flows, the timing of each matters. Direct Alpha uses the IRR of the signed, benchmark-adjusted cash-flow series to obtain an annual rate. Gredil, Griffiths and Stucke (2023), §2.2
Read the method label
Long–Nickels PME buys the index on each call and sells the same dollar amount on each distribution. Its benchmark IRR includes the residual index position, which can go negative if a payout exceeds the available balance. PME+ applies one scaling factor to distributions so that the public portfolio finishes with the private fund’s reported NAV. Cambridge Associates’ modified PME (mPME) instead withdraws the same fraction of the public portfolio as the private fund distributes of its own value at each payout. These variants produce a benchmark return that can be compared with the fund IRR. KS-PME reports a wealth ratio. Gredil, Griffiths and Stucke (2023), §2.3 · Cambridge Associates’ mPME methodology
For an investor-level comparison, use the limited partner’s net cash flows and matching residual NAV. Express the flows, NAV and benchmark series in the same base currency. State the benchmark, hedging convention, cutoff and how you assign index levels to non-trading cash-flow dates. Use a total-return series so reinvested dividends are counted. For an unrealised fund, today’s ratio depends partly on what its remaining assets are marked at. A high ratio shows outperformance against the chosen public alternative. Differences in leverage, sector exposure and liquidity still matter when interpreting that result. Kaplan and Schoar (2005), §II.A · Cambridge Associates on benchmark selection
SelfMadeQuant’s Risk-Adjusted Performance Measures lesson explains why cash-flow timing changes investor returns and how a broader set of benchmark factors can change an attribution result. The preview is public and the full lesson requires membership. Risk-Adjusted Performance Measures
Sources
- Steven N. Kaplan and Antoinette Schoar (2005), Private Equity Performance: Returns, Persistence, and Capital Flows, §II.A.
- Oleg R. Gredil, Barry Griffiths and Rüdiger Stucke (2023), Benchmarking Private Equity: The Direct Alpha Method, §§2.1.2, 2.2 and 2.3.
- Cambridge Associates, A Framework for Benchmarking Private Investments, sections on PME variants and public index choice.