Start with ranks, then choose coordinates
Sort the sample into order statistics, . Assign rank the midpoint plotting position
These are conventional probability levels attached to ranks, not measured probabilities of the individual observations. In particular, with distinct data the empirical CDF at is , not . Midpoints keep every level strictly between zero and one, avoiding infinite endpoint quantiles for many unbounded distributions. They are not the only valid choice: and order-statistic-median approximations are also used. With a small sample, the choice can visibly move the tail points.
| Display | Horizontal coordinate | Vertical coordinate | Model agreement |
|---|---|---|---|
| Theoretical-quantile form used here | Approximately for a fully specified reference in the same units | ||
| P–P form used below | Approximately ; both axes are dimensionless probabilities | ||
| Probability-paper form | Probability labels positioned on a distribution-specific quantile scale | Observations | A straight line under the appropriate model family |
Five executions against a fixed latency model
| Rank | Latency (ms) | Reference quantile (ms) | ||
|---|---|---|---|---|
| 1 | 1 | 0.1 | 0.211 | 0.393 |
| 2 | 2 | 0.3 | 0.713 | 0.632 |
| 3 | 3 | 0.5 | 1.386 | 0.777 |
| 4 | 4 | 0.7 | 2.408 | 0.865 |
| 5 | 8 | 0.9 | 4.605 | 0.982 |
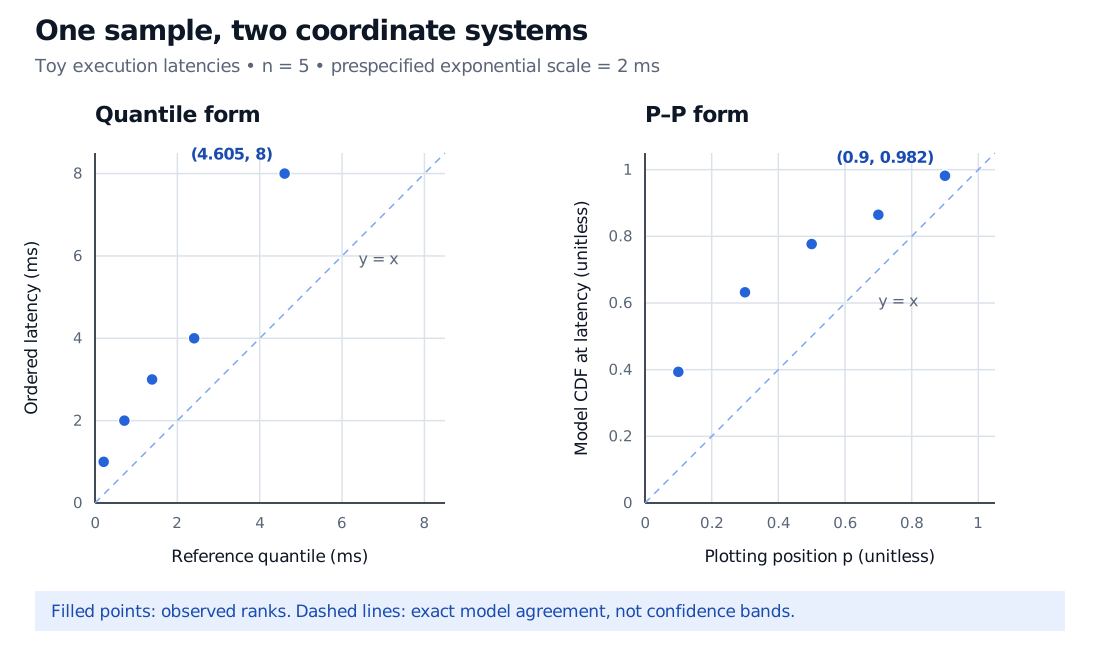
In the quantile panel, every observed latency exceeds its corresponding benchmark quantile. The largest is ms against ms. In the P–P panel, that same observation becomes : the model places roughly 98.2% of its mass at or below ms, while this rank has the chosen 90% plotting position. The probability transformation compresses large values towards one; the quantile panel retains the size of the latency discrepancy in milliseconds.
A straight line answers only the question you set
A fully specified reference gives a fixed identity benchmark. If location and scale are instead unknown, a location-scale family can yield an approximately straight quantile plot with a different intercept and slope. Straightness then concerns the family’s shape; agreement with concerns the particular parameters and units used.
For example, fitting a zero-location exponential by maximum likelihood to these data would give scale ms. That changes the reference quantiles. A line fitted to the plotted points is another estimation procedure and need not give that same estimate. Report which parameters were fixed, which were estimated, and how the reference line was obtained.
A visually straight arrangement is not a p-value. Any formal envelope or test must account for sample size and for parameters fitted from the tested observations. Sorting also removes chronology: a plot cannot reveal whether slow executions arrive in clusters. Check timestamps, operating conditions, rounding and censoring before treating the sample as independent observations from one stable distribution.
Sources
- John A. Rice, Mathematical Statistics and Data Analysis, 3rd edition, Duxbury, 2007, §9.8, “Probability Plots”: probability-integral and quantile constructions, location-scale interpretation, and caution about apparent straightness.
- NIST/SEMATECH e-Handbook, “Probability Plot,” §1.3.3.22: theoretical-quantile axes and an alternative order-statistic-median convention.
- statsmodels,
ProbPlot.ppplotandProbPlot.probplot: probability comparisons and quantile-scaled probability labels. - SciPy,
stats.probplot: software naming, Filliben plotting positions and optional fitted reference lines.