Identify what a market price field measures, then distinguish a last trade, current quotes, a midpoint mark and the cash needed to buy or sell.
Market price
A market price is a price observed in a market for a specified asset, time and trading basis. On a data screen, that label might refer to the latest completed trade, a current quote or an official closing price. A quant must identify the field before using it to value a position, calculate a return or estimate a trade: the number alone does not establish what can be bought or sold now.
Read the field before the number
“Price = 100” leaves several different questions unanswered.
Field
What it tells you
What it does not establish
Last-traded price
The price of the most recent transaction included by that feed
That another transaction is available there now
Bid
A buyer's quoted price for a stated quantity and market scope
The amount you would pay to buy
Ask or offer
A seller's quoted price for a stated quantity and market scope
The amount you would receive to sell
Quote midpoint
The arithmetic average of a matched bid and ask
A committed order at that average price
Official close or settlement
A reference determined under the venue's methodology
The latest intraday execution opportunity
The difference between bid and ask is the bid-ask spread. These quotes also have a venue, timestamp and size. A single venue's bid is a different data field from a consolidated best bid, even when the numbers happen to agree.
The SEC's order-type bulletin explicitly warns that a last-traded stock price need not be the execution price of a new market order.
One screen value, three different amounts
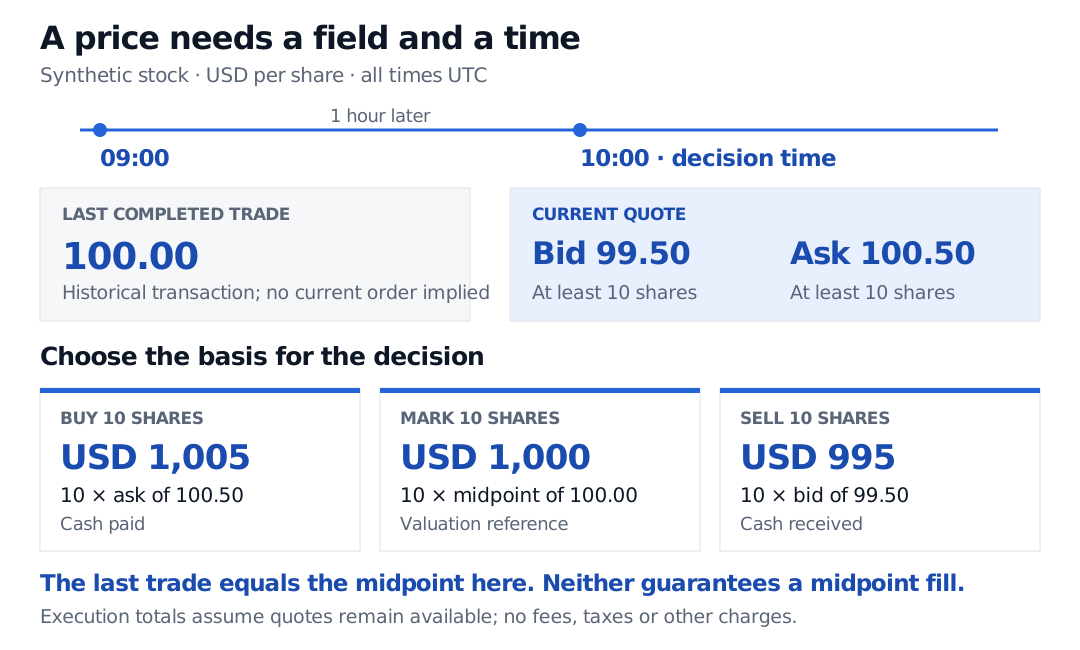
Consider a synthetic stock, quoted in USD per share. The last trade occurred at 09:00 UTC at USD 100.00. At 10:00 UTC, the available bid is USD 99.50 and the ask is USD 100.50, with at least 10 shares at each price. For this calculation, assume the quotes remain available until execution, with no fees, taxes or other charges.
The current midpoint is
m=299.50+100.50=100.00USD per share.
A purchase of 10 shares at the ask costs USD 1,005. A sale of 10 already-owned shares at the bid receives USD 995. Marking those 10 shares at the midpoint gives USD 1,000. The purchase is USD 5 above that mark; the sale proceeds are USD 5 below it.
Synthetic price observations: last trade at 09:00 UTC is USD 100 per share; the 10:00 UTC bid is 99.50 and ask 100.50, each for at least 10 shares. Buying 10 costs USD 1,005; midpoint marking gives USD 1,000; selling 10 receives USD 995.
Original synthetic example. Prices are USD per share; totals are for 10 shares. Execution amounts assume the displayed quantity remains available and exclude charges. A midpoint mark is a valuation reference.
The old trade and the current midpoint happen to equal 100.00. That equality neither refreshes the old transaction nor creates an order at the midpoint. Some trading mechanisms can execute inside the spread, including at a midpoint, but that requires matching liquidity and the applicable order rules. Posting a limit order at 100.00 does not guarantee a fill.
The quantity assumption matters just as much as the price. Ten displayed shares would not establish the cost of buying a much larger position. Liquidity, competing orders and quote changes can alter the realised execution. The SEC's execution guide explains why a screen quote covers a particular quantity and may change before an order arrives.
Carry the basis into the calculation
A usable price record needs the instrument and quote units, the field definition, the market scope, and the observation time. Execution work also needs the available size and the time the system actually received the information. A fresh download of an hour-old trade is still an hour-old trade.
For a return calculation, choose a consistent price series and state its treatment of distributions and corporate actions. For a position mark, state the valuation convention. For a purchase or sale estimate, use the relevant side and sufficient depth, then allow for execution uncertainty. Reusing a column called price across all three tasks can make a backtest's apparent profit depend on an undocumented change of meaning.
Trades, Quotes and Market State develops these distinctions through event and receipt timestamps, quote age and a causal data join. The linked page is a public preview; the full lesson requires membership.
Market observation and valuation answer different questions
A model valuation estimates value under specified cash-flow, risk and discounting assumptions. A market observation records an actual transaction or quotation. Comparing them can inform a trading decision, but disagreement alone does not prove a risk-free profit: the model, the quote basis or the assumed execution may be wrong.
Fair value also has a specific accounting meaning. The IFRS Foundation's IFRS 13 summary describes a measurement based on an orderly transaction between market participants at the measurement date. An arbitrary last print, an investor's preferred forecast and a midpoint calculation are not automatically interchangeable with that measurement. In the example above, USD 1,000 is explicitly a midpoint mark; no accounting conclusion is assumed.
Sources
John C. Hull, Options, Futures, and Other Derivatives, 9th Global Edition, Pearson, 2018, §10.5, “Market Makers,” printed p. 245. Grounding for the buying and selling sides of a dealer quote; the example here is original.