A smaller equity cushion
Consider an illustrative company with asset value , debt value and equity value . All values below use the same arbitrary value unit. Assume debt has fixed value and is locally riskless, while assets have unchanged annualized return volatility . These assumptions isolate the balance-sheet mechanism.
With debt locally unchanged, . An asset-value movement of one unit changes equity by one unit, but represents a larger percentage of the smaller equity base:
Here is the local annualized equity-return volatility implied by these assumptions, not a forecast of the standard deviation of the next year's realised return.
| Balance-sheet state | Asset value | Fixed debt value | Equity value | Assets / equity | Local equity volatility |
|---|---|---|---|---|---|
| Before decline | 100 | 40 | 60 | ||
| After decline | 90 | 40 | 50 |
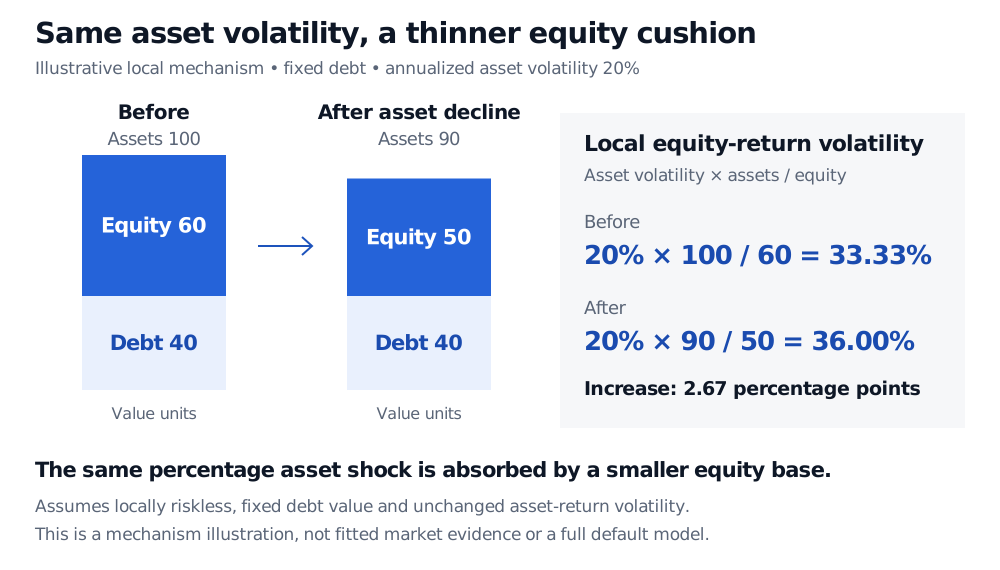
The relation is local. In a full structural equity model, debt value can change with asset value and equity has limited liability. Close to default, extending the fixed-debt formula mechanically is especially misleading. The example demonstrates amplification under stated assumptions, rather than measuring how much of an observed market effect corporate leverage explains.
How a volatility model uses the idea
A symmetric GARCH model reacts equally to positive and negative return surprises of the same magnitude because it uses their squares. To represent an asymmetric response, a threshold variance model can add a term that is active only after negative surprises:
What the label does—and does not—tell you
Several distinctions matter when reading results:
- Causality: volatility feedback offers another channel. If greater expected risk raises the return investors require, prices can fall when volatility expectations rise. News can also affect prices and uncertainty together. In their Nikkei-stock application, Bekaert and Wu find evidence against a pure leverage explanation and in favour of volatility feedback; this is a study-specific result, not a universal ranking of mechanisms.
- Timing and measurement: a same-period return–volatility association, a lagged return–future-volatility relation and an asymmetric fitted variance response are different objects. State the horizon, volatility measure and conditioning information when estimating an effect.
- Other stylised facts: volatility clustering concerns persistence in return magnitudes. Negative skewness concerns the marginal return distribution. Neither property alone establishes the leverage effect.
For forecasting, the useful question is whether return sign improves the conditional risk forecast for the instrument and horizon being modelled. A fitted asymmetry parameter describes that model's response; identifying an economic cause requires further evidence.
Sources
- Alexander J. McNeil, Rüdiger Frey and Paul Embrechts, Quantitative Risk Management: Concepts, Techniques and Tools, revised edition (2015), §4.2.3, pp. 122–123: leverage terminology, asymmetric variance responses and threshold GARCH.
- Geert Bekaert and Guojun Wu, “Asymmetric Volatility and Risk in Equity Markets”, The Review of Financial Studies 13(1), 2000, pp. 1–42: empirical asymmetry and competing leverage/volatility-feedback explanations. The linked university research page provides the authors' abstract and citation.