An execution model may predict the proportions of fully filled, partly filled and unfilled orders. A return model may predict the whole distribution of daily profit and loss. Both can fit one feature while missing another: matching the mean does not establish the right loss tail, and matching outcome proportions does not establish independent outcomes.
Specify what “fits” means
A fit assessment needs a target, a discrepancy and a reference for how much random variation to expect. These choices determine what the assessment can detect.
| Assessment | What it compares | What to watch |
|---|---|---|
| Pearson’s categorical test | Observed category counts versus model expected counts | Binning can hide departures within categories; the usual chi-squared reference is approximate. |
| Kolmogorov–Smirnov test | The largest gap between an empirical and reference cumulative distribution | The standard continuous one-sample calibration requires a fully specified reference distribution. |
| Quantile–quantile plot | Observed quantiles versus model quantiles | Shows where shape departs, but a visual deviation alone has no calibrated rejection probability. |
These assessments complement one another. A plot can reveal which tail is wrong after a test flags a discrepancy. A single reported fit score cannot describe every way a model might fail.
A model that is not rejected
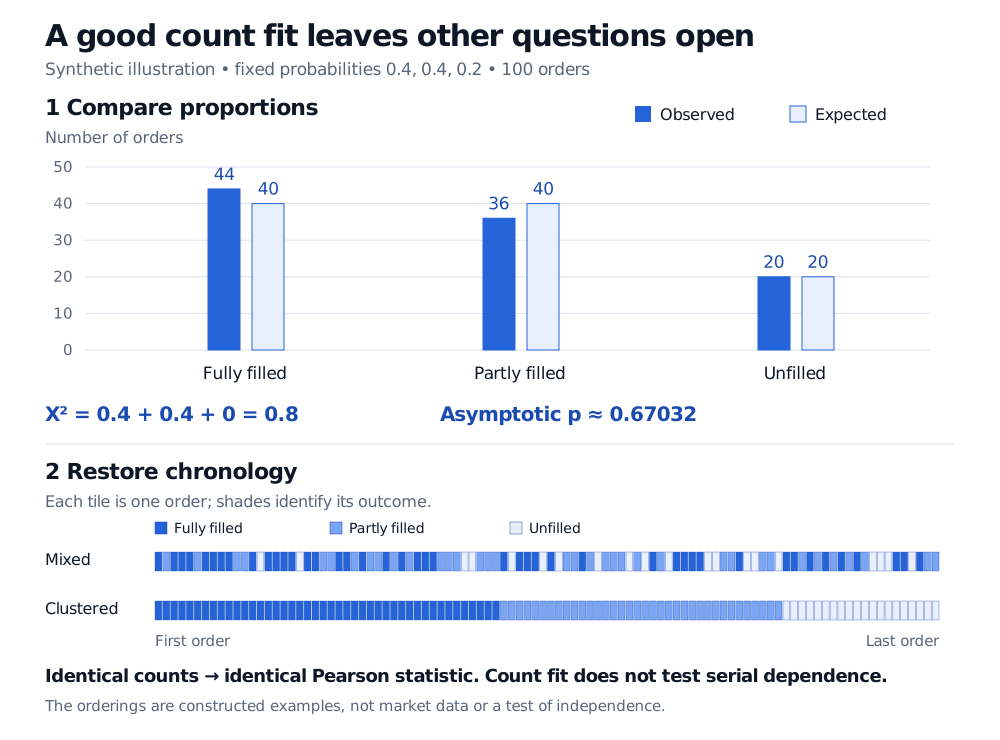
Suppose a hypothetical execution model assigns fixed probabilities , and to fully filled, partly filled and unfilled orders. The categories are exhaustive and mutually exclusive. We stipulate independent orders with the same probabilities; neither the categories nor the probabilities were selected using these observations.
| Outcome | Observed | Expected | Contribution |
|---|---|---|---|
| Fully filled | 44 | 40 | 0.4 |
| Partly filled | 36 | 40 | 0.4 |
| Unfilled | 20 | 20 | 0 |
Pearson’s statistic adds squared deviations, scaled by expected counts:
Here is the number of categories, is the total number of orders, and is the fixed null probability for category . Thus
Fit after fitting needs its own calibration
If model parameters are estimated from the same observations, the model has already adjusted toward the sample. A reference law for a fixed model cannot automatically be reused. Pearson’s familiar degrees-of-freedom adjustment needs the appropriate grouped-data fitting and regularity conditions. Standard continuous Kolmogorov–Smirnov tables likewise need adjustment when the reference parameters were fitted from the tested sample.
For model validation, report what was compared, how parameters were obtained, the sampling assumptions, and the size and location of departures. Then ask whether those departures affect the intended decision. Goodness of fit supplies evidence about a model at a stated resolution; it cannot certify future market behaviour.
Sources
- John A. Rice, Mathematical Statistics and Data Analysis, 3rd edition, Duxbury, 2007, §§9.2.1, 9.5 and 9.9: p-value interpretation, multinomial goodness of fit and parameter-estimation caveats.
- NIST/SEMATECH, “Chi-Square Goodness-of-Fit Test”: count statistic, binning and approximate calibration.
- NIST/SEMATECH, “Kolmogorov–Smirnov Goodness-of-Fit Test”: empirical-distribution comparison and fitted-parameter limitation.
- R statistical documentation, “Pearson’s Chi-squared Test for Count Data”: fixed categorical probabilities and asymptotic versus simulated p-values.