Test binary association within strata, reproduce the CMH statistic and common odds ratio, and distinguish correction, heterogeneity and causal adjustment.
Cochran–Mantel–Haenszel test
The Cochran–Mantel–Haenszel (CMH) test tests whether two categorical variables are associated after conditioning on a third variable that divides observations into strata. In its classical form, each stratum supplies a 2×2 table. A quant researcher can use it to ask whether a binary risk alert is associated with a later loss event within predefined market regimes, rather than letting the regimes’ different compositions drive a pooled comparison.
The null is conditional independence in every stratum. Under a common-odds-ratio model, this is a common odds ratio of one. This page covers that classical binary case; generalised CMH tests also handle larger tables. R’s documentation distinguishes those cases.
Keep the tables separate
Consider a fictional evaluation with one independently observed alert/event pair per unit, and no overlap of units between strata. “Event” means the same predefined loss threshold and horizon throughout. The strata were chosen before seeing these outcomes. These are illustrative counts, not market evidence.
Stratum
Alert
Event yes
Event no
Total
1
Present
12
8
20
1
Absent
8
12
20
2
Present
18
12
30
2
Absent
12
18
30
In each stratum, the event rate is 60% with the alert and 40% without it. The odds ratio is (0.6/0.4)/(0.4/0.6)=2.25. The risk ratio is only 0.6/0.4=1.5: odds and probabilities are different quantities.
Pooling discards the stratum labels. When alert frequencies and baseline event risks differ across strata, it can mix within-stratum association with composition effects—the mechanism behind Simpson paradox. There is no reversal in this deliberately simple fixture; its purpose is to show the CMH calculation transparently.
Let nk=ak+bk+ck+dk, rk=ak+bk be the first-row total and sk=ak+ck the first-column total. Conditional on both row totals and both column totals, independence gives a hypergeometric null distribution for the top-left count Ak:
The nk−1 denominator is part of the conditional hypergeometric variance. Replacing it with nk changes the convention and the reported result. With independent strata and positive total variance, the uncorrected statistic is
QCMH=∑kVk[∑k(ak−Ek)]2.
These are the margin-based expectation and variance calculations in R Core’s implementation. The signed departures are added before squaring; CMH does not add the separate tables’ chi-squared statistics.
For the fictional counts:
Stratum
Observed ak
Null Ek
Departure ak−Ek
Null Vk
1
12
10
+2
2.564103
2
18
15
+3
3.813559
Thus
QCMH=2.564102564+3.813559322(2+3)2≈3.919932.
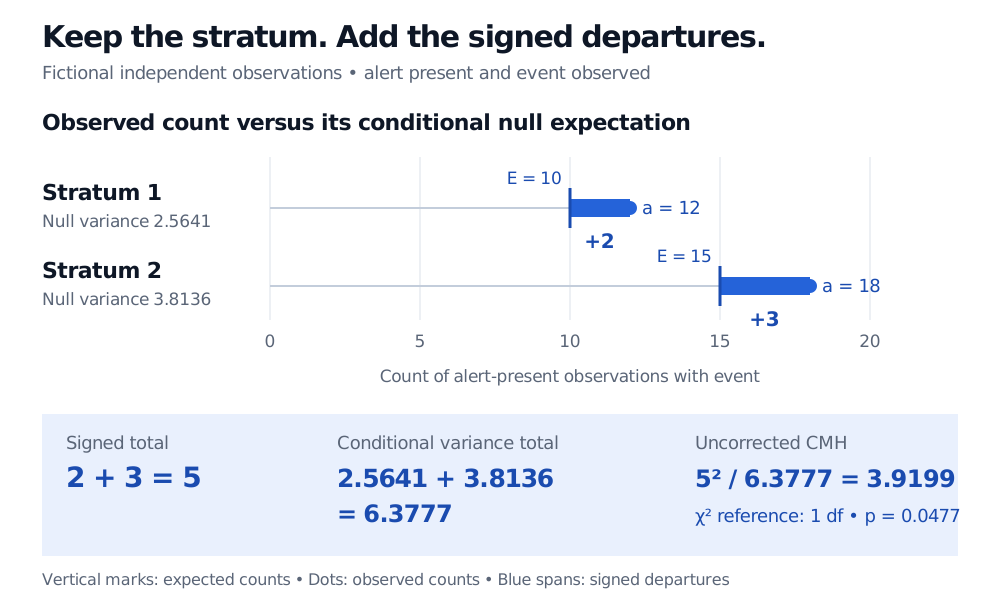
Against the asymptotic chi-squared distribution with one degree of freedom, the two-sided p-value is approximately 0.047717. It is a null-tail probability, not the probability that the alert works or that the null is true.
Fictional independent strata: alert-and-event counts are 12 and 18 versus null expectations 10 and 15. Departures +2 and +3 sum to 5; conditional variances sum to 6.3777. Uncorrected CMH is 3.9199 with asymptotic p-value 0.0477.
Original fictional example. Vertical marks show conditional expectations, dots show observed counts, and blue spans show the signed departures combined by CMH. The chi-squared reference is approximate.
Report the correction convention
A continuity correction changes the numerator. For this example, subtracting 0.5 from the absolute summed departure gives
That crosses the familiar 5% threshold, despite identical observations. Report the statistic, correction choice and p-value together; do not choose the correction after inspecting which result is preferred. R’s documented default enables a continuity correction; its implementation applies the subtraction when the absolute departure is at least 0.5. NIST’s Dataplot reference also displays a continuity-corrected version.
The variance above is exact for the conditional null model. The reported chi-squared p-values are asymptotic, not exact conditional p-values. With few strata and sparse counts, an exact conditional test can be more appropriate. R offers that separately; an exact calculation can also return a different odds-ratio estimator.
Association size and its limits
The Mantel–Haenszel common-odds-ratio estimate is
θMH=∑kbkck/nk∑kakdk/nk.
NIST gives this stratified estimator. Here its numerator is 122/40+182/60=9, its denominator is 82/40+122/60=4, and the estimate is 2.25. It is neither an arithmetic average of stratum odds ratios nor, in general, the odds ratio of the pooled table.
A common summary needs a credible common association. Examine stratum-specific effects: strong positive and negative departures can cancel. The CMH p-value does not test homogeneity, and nonrejection does not establish independence against every heterogeneous alternative. If the association differs materially by regime, retain that structure in the analysis instead of relying on one common number.
Stratification alone also does not identify causation. Conditioning on a well-chosen confounder may support an adjustment strategy, but CMH cannot certify the choice of strata or remove unmeasured confounding. Repeated observations from the same asset, overlapping event horizons and correlated market shocks violate the independent-observation setup used here; ordinary CMH uncertainty does not account for those dependencies.
For a finance application of the underlying cross-product ratio, see the contingency-table section of Performance Persistence and Survivorship Bias. It classifies funds as winners or losers in successive periods. The full lesson requires membership, with a public preview available; it supplies an application of odds ratios rather than a stratified-CMH derivation.
A cancellation check
Two new fictional independent strata have cells (a,b,c,d)=(8,4,4,8) and (4,8,8,4), using the same row/column meanings as above. Use the uncorrected statistic. Can CMH give p=1 even though neither stratum’s sample odds ratio is one?
Answer. Yes. Each stratum has first-row and first-column totals of 12 out of 24, so Ek=6. The departures are +2 and −2, giving QCMH=0 and an asymptotic p-value of 1. Yet the sample odds ratios are 4 and 1/4. The opposite associations cancel; this is a warning against interpreting a common-direction test as a general test for every possible pattern across strata.
Sources
R Core Team, Cochran-Mantel-Haenszel Chi-Squared Test for Count Data, Description, Arguments, Value and Note: binary/generalised cases, correction and exact options, common-odds-ratio interpretation and homogeneity limits. Development documentation checked 30 October 2026.
R Core Team, mantelhaen.test.R, classical 2×2×K branch: conditional-margin statistic, correction guard and Mantel–Haenszel estimator. Source checked 30 October 2026.
NIST Dataplot, Mantel-Haenszel Test, Description and Notes: common-odds-ratio estimator, corrected statistic and sparse-data limitations.