Compare event odds across two groups, distinguish odds ratios from risk ratios, and interpret a loan-default table and logistic-regression coefficient.
Odds ratio
An odds ratio compares the odds of the same event in two groups. If a credit analyst reports a default odds ratio of 0.444 for group A relative to group B, A has about 44.4% of B's default odds. That statement alone does not say that A has 44.4% of B's default probability.
Write pA=P(D∣A) and pB=P(D∣B) for the conditional probabilities of default over the same horizon. For 0<pA,pB<1,
ORA:B=pB/(1−pB)pA/(1−pA).
It is dimensionless. An odds ratio of 1 means equal event probabilities, above 1 means higher odds in A, and below 1 means lower odds in A. The order of the groups and the definition of the event belong in the statement of the result.
Two loan cohorts, three answers
Consider two synthetic complete cohorts, each containing 100 loans followed for one year, with every loan's default outcome known. These invented counts illustrate arithmetic; they are not market estimates.
One-year outcome
Cohort A
Cohort B
Default
10
20
No default
90
80
Total loans
100
100
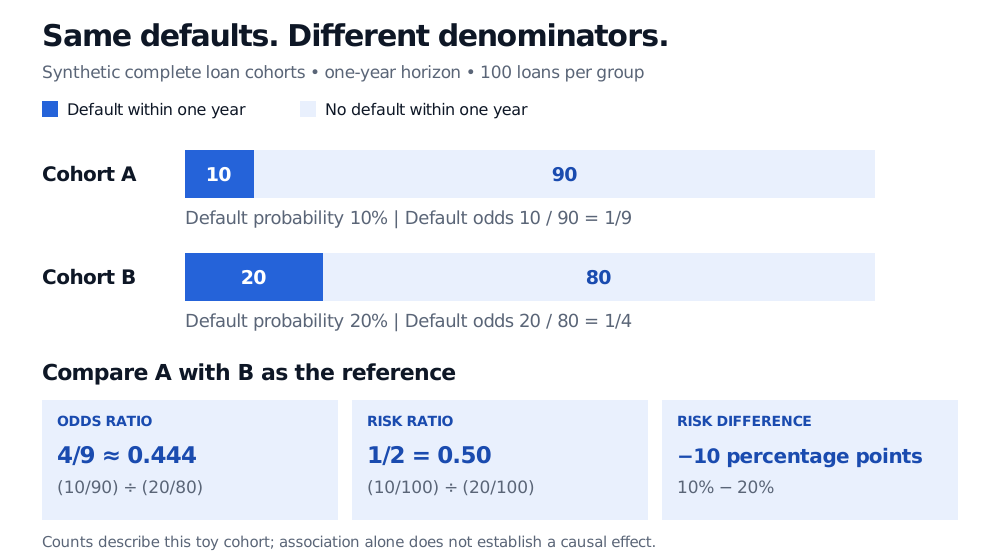
A's default probability is 10/100=10%, but its default odds are 10/90=1/9. B's default probability is 20%, and its default odds are 20/80=1/4. Consequently,
ORA:B=20/8010/90=90×2010×80=94≈0.444.
A has about 55.6% lower default odds than B. For the same table, the risk ratio, which compares probabilities, is 0.10/0.20=0.50: A's default probability is half B's. The risk difference is 0.10−0.20=−0.10, or 10 percentage points lower. These measures answer different questions; 55.6% lower odds is not a 55.6% reduction in default probability.
Synthetic one-year loan cohorts: A has 10 defaults and 90 nondefaults; B has 20 defaults and 80 nondefaults. A versus B odds ratio is 4/9, risk ratio is 1/2 and risk difference is minus 10 percentage points.
Original synthetic complete-cohort comparison, with 100 loans in each group and the same one-year default definition. Odds use nondefaults as the denominator; risks use all loans.
Reversing the reference group gives ORB:A=9/4=2.25. Keeping the groups fixed but changing the event to no default also takes the reciprocal. An unlabelled odds ratio is therefore easy to misread.
Reading a two-by-two table
Let the counts be a defaults and b nondefaults in A, and c defaults and d nondefaults in B. With all four cells positive,
ORA:B=c/da/b=bcad.
This is the cross-product ratio. In a fully observed cohort, the corresponding risks are a/(a+b) and c/(c+d); using those denominators produces the risk ratio instead.
The sampling design matters. If a study deliberately selects defaulted loans and nondefaulted controls, its chosen mix of cases and controls generally cannot reveal population default probabilities. In a simple unmatched design, if selection probabilities depend only on default status, the population odds ratio is preserved in the selected distribution: the two outcome-specific selection factors cancel. The sample ratio then estimates that parameter. That algebra does not validate a biased control sample. Matched studies and other sampling schemes require their corresponding analysis; a selected sample's raw default fraction is not automatically a population default risk. CDC's comparison of association measures explains the standard cohort versus case-control distinction.
For observed data, the computed ratio is an estimate. A small table can be very uncertain even when its ratio looks large. Zero cells can give zero, an infinite boundary value or an undefined ratio, depending on which cells vanish. Do not silently add a pseudocount to every cell: any correction, exact procedure or penalised model changes the analysis and needs an explicit justification.
Increasing x by one unit changes log-odds by β1, so it multiplies odds by eβ1. With an indicator x=1 for A and x=0 for B, eβ1 is the model's A-to-B odds ratio. With additional covariates, this interpretation holds at fixed values of those covariates, provided the model has the stated additive form without interactions involving x. Adjusted and raw table odds ratios need not agree. UCLA's coefficient interpretation derives this exponentiation.
An odds ratio still needs a baseline probability to become a probability forecast. If the odds ratio is θ and B's probability is pB, then
pA=1−pB+θpBθpB.
Substituting θ=4/9 and pB=0.20 recovers pA=0.10. The distinction from a risk ratio can also be seen directly:
ORA:B=pBpA1−pA1−pB.
When both event probabilities are small, the second factor is close to 1, so the odds ratio approximates the risk ratio. This is an approximation with a baseline-dependent error, not a permission to relabel every odds ratio as relative risk.
Finally, an odds ratio measures association. Different leverage, collateral, underwriting or macroeconomic exposure could explain the cohort contrast. Neither the table nor exponentiating a fitted coefficient establishes that changing group membership would cause the reported change in default risk.
James, G., Witten, D., Hastie, T., Tibshirani, R. and Taylor, J. An Introduction to Statistical Learning: with Applications in Python (2023), §4.3.1, “The Logistic Model,” pp. 139–140: odds, log-odds and multiplicative coefficient interpretation.