The Beneish M-score is a financial-statement screen for possible earnings overstatement. It combines eight accounting measures from two consecutive fiscal years into a score. A higher score gives an analyst a reason to move a filing up the review queue and check which reported numbers drove it. Beneish estimated the model on historical cases of publicly discovered manipulation and industry-matched companies. Beneish, The Detection of Earnings Manipulation.
Start with receivables
A fictional wholesaler reports year-end receivables of 20 on annual sales of 100, up from receivables of 12 on sales of 80. The days’ sales in receivables index (DSRI) compares how much sits in receivables for each unit of sales:
The balance rose from 15% to 20% of annual sales. At this year’s sales level, the old share would imply receivables of 15. The five-unit difference is what deserves a closer look. Longer customer payment terms could produce that increase even if every sale was valid. So could revenue booked before the company earned it. DSRI is one of eight inputs, and both explanations can produce the same value. Beneish, “The Model”.
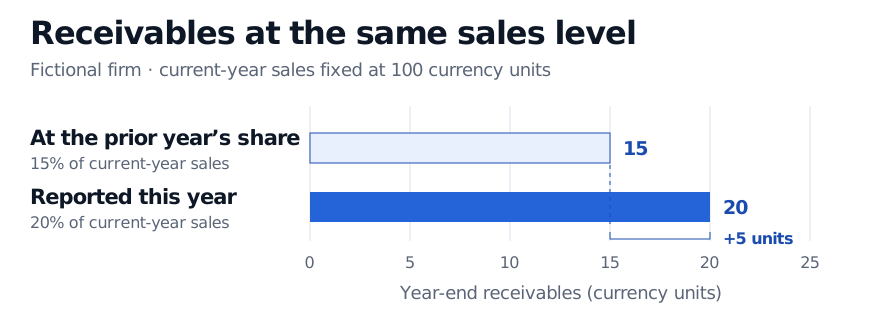
Holding sales fixed makes the change in the receivables share visible.
How the eight inputs combine
The unweighted probit estimate in Beneish’s Table 3 gives this fitted index:
All eight inputs are unitless ratios in decimal form. Use the same currency units and comparable periods and reporting scope for the underlying items. Table 2 of the paper gives the original line-item definitions. Beneish, Tables 2 and 3.
| Input | What it compares |
|---|---|
| DSRI, days’ sales in receivables index | Current receivables-to-sales ratio divided by the prior year’s. |
| GMI, gross margin index | Prior gross margin divided by current gross margin. Gross margin is gross profit divided by sales. |
| AQI, asset quality index | Current share of assets outside current assets and net property, plant and equipment (PP&E) divided by the prior year’s share. |
| SGI, sales growth index | Current sales divided by prior sales. |
| DEPI, depreciation index | Prior depreciation rate divided by the current rate, where the rate is depreciation divided by depreciation plus net PP&E. |
| SGAI, SG&A expense index | Current selling, general and administrative expenses as a share of sales divided by the prior year’s share. |
| TATA, total accruals to total assets | Current-year balance-sheet accruals divided by current total assets. The original calculation takes the change in noncash working capital, with adjustments for current maturities of long-term debt and taxes payable, then deducts depreciation and amortisation. |
| LVGI, leverage index | Current leverage divided by prior leverage, where leverage is current liabilities plus long-term debt, divided by total assets. |
Holding the other seven inputs fixed, raising DSRI from to lifts the fitted score by about . This isolates one coefficient’s contribution. The full score requires the remaining inputs.
Zero sales in either year or zero prior-year receivables makes DSRI undefined. A small denominator can make an index jump, and a gross margin that changes sign defeats the usual interpretation of GMI. Beneish capped extreme observations at the first and 99th percentiles, used 1 when the prior AQI share was zero, and used 1 for DEPI when intangible amortisation was unavailable or for SGAI when SG&A was unavailable. Treat those as specific conventions of the historical fit and document any substitutions when reproducing it. Beneish, “Distribution of Variables”.
What to do with a high score
The raw score is on the probit model’s index scale. Applying the standard normal cumulative distribution function yields a probability under the fitted model, whose training sample deliberately overrepresented discovered manipulators. Interpreting it as a probability today would require calibration in the population being screened. One decision rule in the paper flagged scores above about when missing a manipulator was treated as 20 or 30 times as costly as a false alarm. In the historical holdout, that rule still missed half of the known manipulators. A threshold sets the trade-off between what enters the review queue and what slips past it. Beneish, Table 5 and the holdout results.
For the wholesaler, start with the revenue recognition policy and receivables allowance. Check for changed payment terms, customers taking longer to pay and any acquisition that changed the reporting perimeter. An earnings quality review then asks whether cash collections and the filing notes support the reported sales. For a historical screen, use the numbers available at each filing date to avoid look-ahead bias from later amendments.
The SelfMadeQuant capstone shows the same separation in a filing workflow. The project uses its own deterioration model, which includes a cash-flow-based accrual input, to prioritise reviews. A separate event feed surfaces notices such as a filing that says prior statements can no longer be relied on. In the project replay, the event feed caught one such case that stayed below the model’s alert threshold. Financial Filing Change and Deterioration Monitor (membership).
Sources
- Messod D. Beneish (1999), The Detection of Earnings Manipulation, Financial Analysts Journal 55(5), 24–36. Corrected article text uploaded by the author, CFA Institute publication record.