The Basel traffic-light test classifies a bank's count of value-at-risk exceptions into supervisory response zones. Its practical consequence is that repeated losses beyond the forecast threshold can increase capital requirements or threaten permission to use an internal model. The familiar green/yellow/red scheme originated in the 1996 market-risk framework; today's Basel bank-wide backtest uses green/amber/red and different multipliers.
Count exceptions against the right forecast
For an illustration with positive numbers denoting losses, let be the loss on day and the one-day 99% VaR forecast made before that loss is observed. Define
Equality to the threshold is not an exception under this strict-exceedance definition. The horizon matters: comparing a ten-day VaR forecast with one day's loss changes the question.
Consider a fictional record of 250 nonoverlapping daily forecasts and six exceptions. The observed exception rate is . Under the illustrative null that the indicators are independent with a common 1% exception probability,
and the exact upper-tail probability is
Thus six or more exceptions occur about 4.12% of the time in that null model. This is a probability of data under specified assumptions, not a 4.12% probability that the bank's model is correct. Nonoverlapping days alone do not establish independence; the binomial distribution needs that additional assumption.
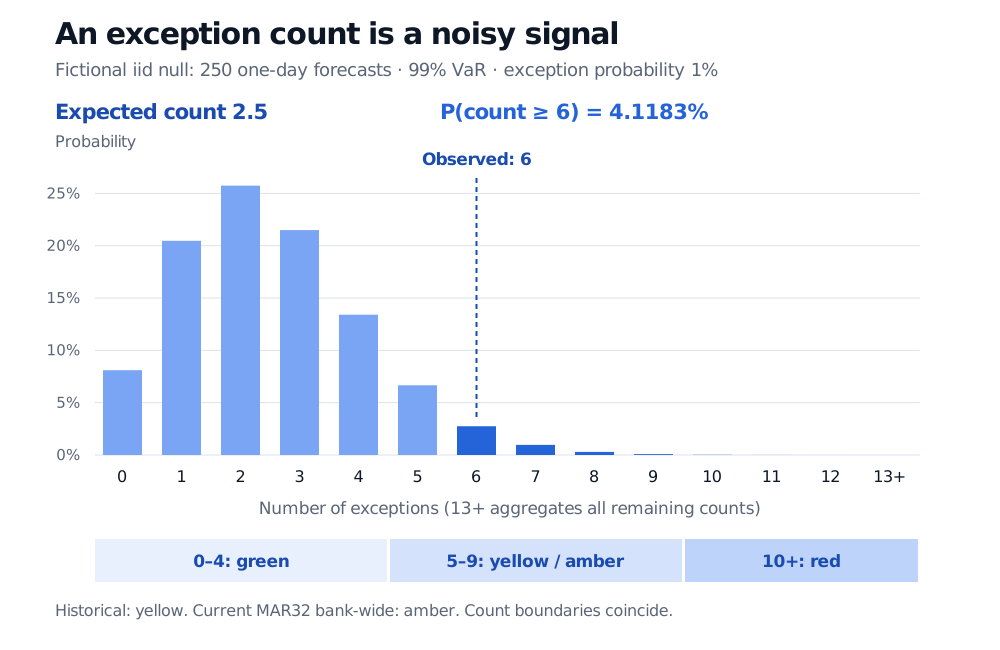
Figure: Original calculation under the declared iid null. Darker bars contain the entire upper tail from six onward, including the final aggregated bar. The zone strip is a supervisory classification, not a probability that the model is sound.
The indicator-sum derivation of the mean is developed in Means and Variances of the Named Distributions (public preview; full lesson requires membership).
The historical rule and the current standard
The January 1996 framework used 0–4 green, 5–9 yellow and 10 or more red, for 250 one-day 99% observations. Its Table 2 gave additions of 0, 0.40, 0.50, 0.65, 0.75, 0.85 and 1.00 for the count bands shown below, in the baseline-three regime. Six exceptions therefore corresponded to a presumptive total multiplier of . Yellow outcomes called for investigation and generally a higher multiplier; they were not treated as conclusive proof of misspecification. BIS now marks the 1996 publication as superseded.
Current Basel standard, checked 30 October 2026: BIS labels MAR32 current, effective 1 January 2023. Table 1 gives these bank-wide 99% backtesting-dependent multipliers:
| Exceptions in 250 observations | Current bank-wide zone | Multiplier before any qualitative add-on |
|---|---|---|
| 0–4 | Green | 1.50 |
| 5 | Amber | 1.70 |
| 6 | Amber | 1.76 |
| 7 | Amber | 1.83 |
| 8 | Amber | 1.88 |
| 9 | Amber | 1.92 |
| 10 or more | Red | 2.00 |
Under MAR33.41–33.43, starts at 1.5, with a backtesting addition from 0 to 0.5 and possible qualitative additions. VaR remains the diagnostic even though the current capital framework uses expected shortfall (MAR33.1–33.3). The multiplier enters capital aggregation; it does not scale every capital component. Six bank-wide exceptions therefore correspond to 1.76 before qualitative additions, not the historical 3.50. Nor does 1.76 mean “add 1.76 to 1.5.”
MAR32 requires comparison against actual P&L and hypothetical P&L separately, using the larger exception count, rather than their sum. Desk eligibility has a separate backtest: one-day VaR at both 97.5% and 99%, with more than 30 or more than 12 exceptions respectively triggering the standardised approach. The separate P&L attribution test compares risk-theoretical P&L with hypothetical P&L. Bank-wide zone thresholds cannot substitute for these desk requirements. See MAR32.4–32.20.
These are Basel standards, not a statement that this version operates as law for every bank on that date. The BCBS Charter, §§3 and 12, distinguishes international standards from their incorporation into local legal frameworks. Applying the table to an actual institution requires the jurisdiction's operative rules, implementation date and model permissions.
INTERACTIVE EXPLORER
Historical 250-day exception count
Compare a supplied exception count with an iid 1% binomial benchmark.
A green count leaves questions open
A count discards both the timing and size of exceptions. Four isolated small exceedances and four consecutive very large exceedances receive the same count, although their risk implications differ. Exception clustering needs a separate dependence diagnostic, while loss severity requires information beyond the indicators. A green classification therefore does not establish that the model captures stressed dynamics, tail severity or all material model risk.
Even under the declared iid null, the calculated probability of at least five exceptions is about 10.78%. This differs from because it also includes exactly five. A traffic-light boundary should not be silently replaced by a conventional 5% hypothesis-test cutoff.
Sources
- BCBS, January 1996 backtesting framework, §II, §III(c)–(f) and Table 2. Historical scheme; superseded.
- Basel Framework MAR32, §§32.4–32.20 and 32.25. Current version shown effective 1 January 2023.
- Basel Framework MAR33, §§33.1–33.3 and 33.41–33.44. Expected shortfall, multiplier and capital aggregation.
- BCBS Charter, §§3 and 12. Legal status and domestic implementation.