The Adrian–Crump–Moench (ACM) term premium model is a no-arbitrage statistical model that splits fitted U.S. Treasury yields into a component associated with expected future short rates and an estimated term premium for bearing interest-rate risk. When the ten-year yield rises, the split helps an analyst assess whether the model attributes the move mainly to a higher expected path for short rates or to a higher premium for holding a long bond. New York Fed Treasury Term Premia
Two prices for the same maturity
ACM uses the same date, maturity and current yield-curve factors in two runs of its bond-pricing equations. The fitted yield uses the estimated prices of factor risk. The zero-risk-price yield sets those risk prices to zero while keeping the other parameters fixed. The paper calls this second yield the risk-neutral yield. In this counterfactual the factors follow their estimated historical dynamics in the pricing equations. The short rate can still vary, and the bond-pricing equations retain their variance terms. Adrian, Crump and Moench (2013), §2.4
In a fictional example, both yields are annualised, continuously compounded rates on a ten-year zero-coupon bond. A fitted yield of 4.20% and a zero-risk-price yield of 3.50% give
The positive estimate means the fitted yield is 70 basis points above the model’s benchmark with risk prices switched off. If the ten-year input yield from the market curve is 4.28%, the extra 8 bp above the fitted yield is the fit error. Subtracting the benchmark directly from the market input would blend the two gaps.
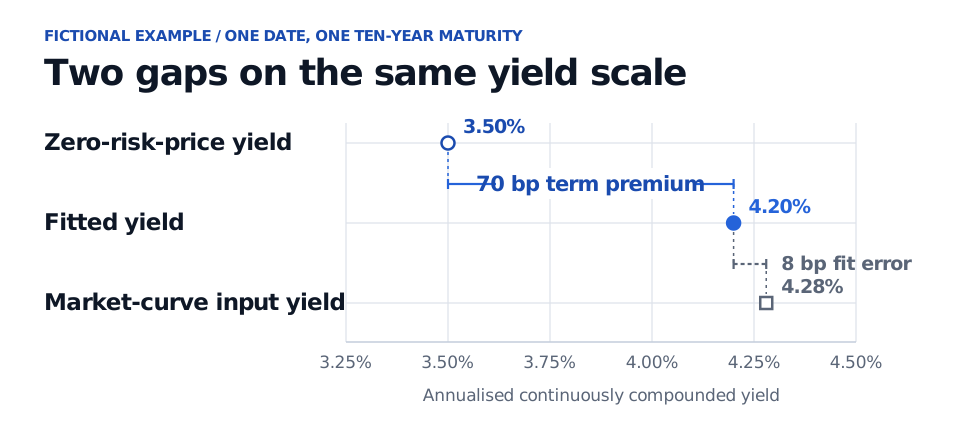
Both gaps are measured on the same yield scale. Only the comparison between the two model yields enters the ACM term premium.
How the model estimates risk prices
The New York Fed’s implementation uses five principal components of zero-coupon Treasury yields. These are combinations of yields that summarise how the curve moves. The regressions track how those factors evolve and how bonds of different maturities respond to them. ACM paper, §§2.1–2.2 and 3.1
- Separate expected factor moves from surprises. Regress the factor values on their values in the previous period. The residuals estimate the surprise changes, and their covariance measures how those surprises move together.
- Measure how bonds respond. For each maturity, regress log holding-period excess returns over the short risk-free rate on the factor levels at the start of the holding period and the factor surprises during it. The surprise coefficients measure exposure to shocks. The coefficients on previous levels measure how the expected excess return varies with the state of the curve.
- Estimate a common price for each factor’s risk. Across maturities, regress the return intercepts (after a convexity adjustment) and the coefficients on previous factor levels on the shock exposures. This relates the compensation the model assigns to a bond to the amount of each risk it bears. The fitted risk prices can change with the state of the curve.
The model also fits the short rate as a function of the same factors. The estimated short-rate equation, factor dynamics and risk prices feed the no-arbitrage bond-pricing equations, which generate yields across maturities from a common pricing rule. ACM paper, §§2.4 and 3.1
Reading the published series
The New York Fed provides fitted yields, expected-short-rate components and term-premium estimates at each whole-year maturity from one to ten years, with daily and end-of-month observations. Compare the two components at the same maturity across dates to see which one accounts for a change in its fitted yield. New York Fed Treasury Term Premia
The split depends on the estimated factor dynamics and prices of risk. Even when a model tracks market yields closely, its implied path for short rates can differ from the path another model or a survey implies. The New York Fed authors show periods in which ACM and survey-informed estimates assign substantially different shares of the same long yield to the term premium. Adrian, Crump, Mills and Moench (2014)
Sources
- Adrian, Crump and Moench (2013), Pricing the Term Structure with Linear Regressions. Journal of Financial Economics, 110(1), 110–138. Sections 2 and 3 give the regression estimator and the yield construction.
- Federal Reserve Bank of New York, Treasury Term Premia. Published estimates and definitions of the three series.
- Adrian, Crump, Mills and Moench (2014), Treasury Term Premia. Data construction and comparison with survey-based estimates.