Sticky-price inflation is the rate of price growth for a weighted group of goods and services whose prices typically change infrequently. A slowdown in headline inflation can come from falling or flattening prices in faster-moving categories even while slower-moving categories keep rising. Tracking both groups helps a forecaster locate the source of the slowdown.
How often a price resets and how far it moves
A shop can change its gasoline price repeatedly in a month and end the month where it started. An insurer can hold each customer's premium fixed until renewal, then raise it substantially. The frequency of changes in individual prices determines stickiness. The size and direction of those changes, and when customers face them, help determine the category's inflation rate. When renewal dates are staggered, a category index can move each month even when individual prices seldom reset. Atlanta Fed explainer
The Atlanta Fed's Sticky-Price CPI groups published U.S. Consumer Price Index components by historical price adjustment frequency and forms sticky and flexible subindexes with expenditure weights. In the published construction, components are sticky if the average interval between price changes exceeds 4.3 months. That cutoff comes from the research behind the series. It applies at the component level, where an average can hide different pricing schedules, and a category keeps its classification even if it posts an unusually large change in a given month. Atlanta Fed Sticky-Price CPI · Bryan and Meyer, construction and Table 1
Each inflation measure answers a different question about the basket.
| Measure | What it keeps |
|---|---|
| Headline CPI | All items in the CPI basket, including food and energy. |
| Core CPI | All CPI items except food and energy, including some frequently repriced categories. |
| Sticky CPI | Slow-to-reprice categories, including some food categories such as food away from home. |
| Core Sticky CPI | The sticky categories that remain after excluding food and energy. |
| Trimmed-mean CPI | The middle of that month's weighted distribution of component price changes. Which categories are trimmed can change each month. |
Headline inflation can fall while sticky inflation holds steady
Take a fictional fixed-quantity basket with 60% of starting spending in flexible categories and 40% in sticky categories. Compare two possible outcomes for the same one-year interval from the same starting basket. In A, flexible prices rise 4% and sticky prices rise 2%. In B, flexible prices end the year flat and sticky prices still rise 2%. Weight each group's rate by its starting spending share.
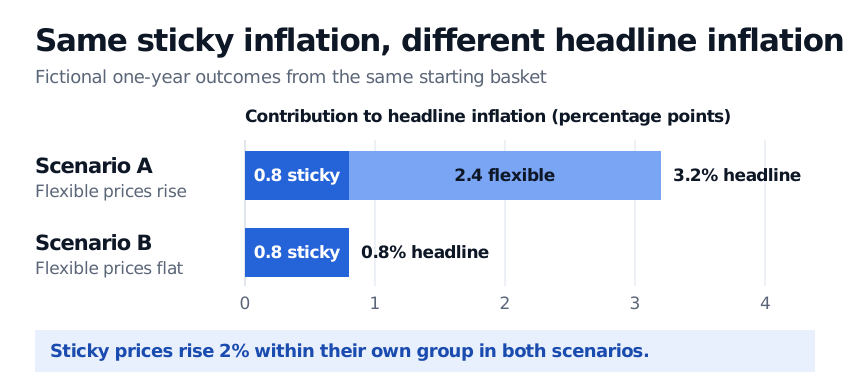
The bars show how each group contributes to the fictional whole basket. The sticky-only rate uses the sticky group's own starting cost as its denominator.
In both cases the sticky group's rate is 2%. Its contribution to the whole basket is 0.8 percentage points because it starts at 40% of spending. The entire 2.4-point difference in headline inflation comes from the flexible group in this example. The weights here are chosen for the example. They differ from the expenditure shares used in the Atlanta Fed series.
What the split tells a forecaster
Compare rates over the same horizon and on the same annualisation basis. If sticky inflation holds up as headline inflation falls, inspect which components account for the gap. For example, lease renewals and the way CPI measures rents and owners’ equivalent rent can keep measured shelter inflation elevated after rents on new leases cool. That pattern has a different interpretation from price increases spread across many sticky categories. BLS on shelter price measurement
Firms that set prices for several months may build expected future costs into each reset. That motivates using sticky inflation as one input in a Phillips curve forecast. The observed rate combines expectations with other influences, including past cost changes that reach customers at renewal. A frequency split cannot isolate the effect of monetary policy on those prices. Bryan and Meyer, forecast experiment and conclusion
Sources
- Federal Reserve Bank of Atlanta, Sticky-Price CPI and series explainer
- Michael F. Bryan and Brent Meyer, Are Some Prices in the CPI More Forward Looking Than Others? We Think So.
- Federal Reserve Bank of Cleveland, Consumer Price Data and Measures Explained
- U.S. Bureau of Labor Statistics, Common Misconceptions about the Consumer Price Index
- U.S. Bureau of Labor Statistics, Measuring Changes in Shelter Prices in the Consumer Price Index