What profits are attainable?
Suppose a hypothetical trading project has already incurred a USD 16 setup cost. Let be the numerical quantity in shares, allowing fractional shares from 0 to 10. Its synthetic net-profit rule, with output measured in USD, is
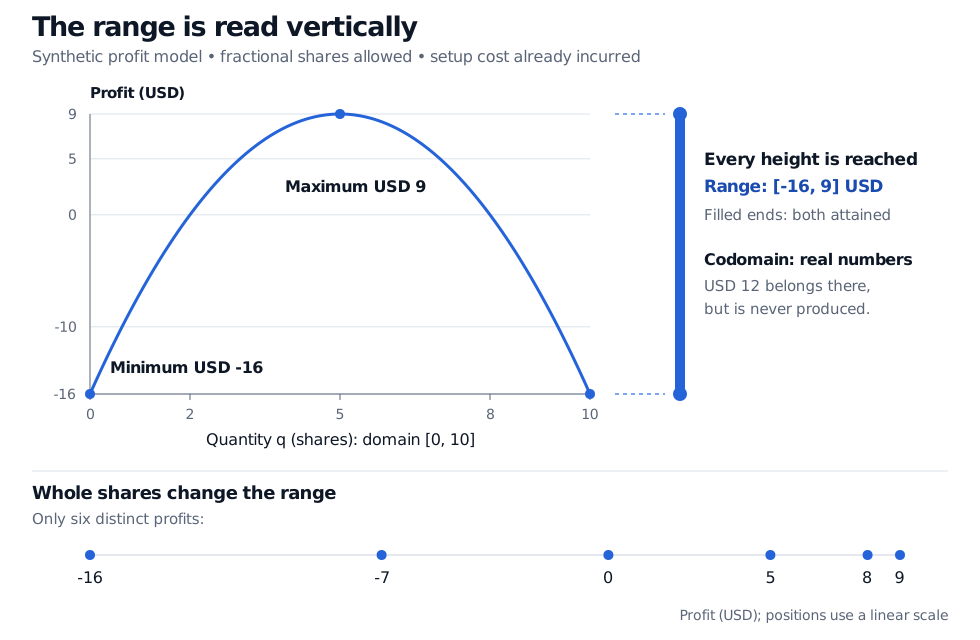
The coefficient of represents a deliberately simplified size penalty; this is an illustrative model, not an estimated trading opportunity. The setup cost remains incurred even at , so the model reports a USD 16 loss there.
The square gives the bounds without calculus. Over the allowed quantities,
At the profit is USD 9. At either or it is USD -16. Both bounds are attained. But bounds alone do not establish that every value between them is possible.
To check that no outputs are missing, choose any target between and . The quantity
lies between 0 and 5 and satisfies . Thus every target in the interval is reached, and the range is exactly
Square brackets mean the endpoints belong to the set. Choosing as the codomain is valid, but it does not make every real profit attainable: USD 12 is in that codomain and outside this range.
Change the allowed inputs, change the answer
The formula alone does not determine the range.
| Allowed quantities, in shares | Attainable profits, in USD |
|---|---|
| Every real | The entire interval |
| Whole shares | The set |
| Every real | The interval |
| Every real | The interval |
Whole shares leave gaps: USD 6 is attainable with a fractional quantity , but no integer quantity gives it. The minimum and maximum remain the same, so reporting only those two numbers would hide the change.
On the smaller closed domain , the function rises from to ; the original peak at is unavailable. On the open domain , neither endpoint quantity is allowed, so USD -16 is approached but never reached. USD 9 remains attainable at . An excluded input removes an output only if no remaining input produces it.
In practice, state the domain before claiming a profit range. Quantity limits, indivisibility and model restrictions can all alter it. And a range is a set of possibilities under the model: it does not say how likely an output is, or guarantee that actual trading results will respect the model’s bounds.
Sources
- University of Oxford, Introduction to University Mathematics (2025–26), §3: Functions, Definitions 3.2 and 3.7: domain, codomain and image.
- OpenStax, Calculus Volume 1, §1.1: Review of Functions: domain, range and graphical representations.
- Stewart, J. (2008). Single Variable Calculus: Early Transcendentals, 6th ed., Brooks/Cole, §1.1, “Four Ways to Represent a Function,” pp. 11–13.