The Piotroski F-score is a count from 0 to 9 of favourable signals in a company’s annual accounts. It combines profitability, leverage and liquidity, equity issuance, and operating efficiency. An equity researcher can use it to sort companies that already look cheap by book-to-market and see which accounting signals distinguish them. Book-to-market is book equity divided by market equity. Piotroski tested the score within the highest book-to-market group from 1976 to 1996. Piotroski (2000), §§2.3 and 3.
How a company earns six points
Give one point for each condition met. Use two comparable fiscal years, with the asset balance at the start of each year and the latest year-end. Compare unrounded ratios. The table follows the order in which the paper introduces the signals in §§2.3.1–2.3.3. Its sample company is a fictional manufacturer, and all statement amounts are in millions of the same currency. Piotroski, §2.3 and Table 1 notes.
| Signal | One point if… | Fictional comparison | Point |
|---|---|---|---|
| Profitability · ROA | Return on assets is positive. Use net income before extraordinary items divided by opening total assets. | Current ROA is 6 / 120 = 5%. | 1 |
| Profitability · CFO | Operating cash flow divided by opening total assets is positive. | Current scaled CFO is 12 / 120 = 10%. | 1 |
| Profitability · ΔROA | ROA rose from the prior year. | ROA fell from 8 / 100 = 8% to 5%. | 0 |
| Profitability · Accrual | Scaled operating cash flow exceeds ROA. | 10% exceeds 5%. | 1 |
| Financing · ΔLeverage | Long-term debt divided by average total assets fell. Include the current portion of long-term debt. | Leverage rose from 22 / 110 = 20% to 35 / 140 = 25%. | 0 |
| Financing · ΔLiquidity | The year-end current ratio, current assets divided by current liabilities, rose. | The ratio rose from 36 / 24 = 1.50 to 48 / 24 = 2.00. | 1 |
| Financing · Equity issuance | The company issued no common equity in the fiscal year used for the score, before portfolio formation. | The latest fiscal year had no common equity issue. | 1 |
| Operating efficiency · ΔGross margin | Gross profit divided by net sales rose. | Margin rose from 45 / 150 = 30% to 63 / 168 = 37.5%. | 1 |
| Operating efficiency · ΔAsset turnover | Net sales divided by opening total assets rose. | Turnover fell from 150 / 100 = 1.50 to 168 / 120 = 1.40. | 0 |
The score is . The asset balances are 100 at the prior year’s opening, 120 at its close and 160 at the current year’s close. For the leverage denominator, average each year’s opening and closing assets. The accrual comparison uses the same opening assets for both quantities, so for positive opening assets it comes down to whether operating cash flow exceeds the specified net income measure. Check issuance in the financing section of the cash flow statement and the equity disclosures. Net repurchases can conceal issuance if you look only at the change in shares outstanding. Piotroski, §§2.3.1–2.3.2 and note 16.
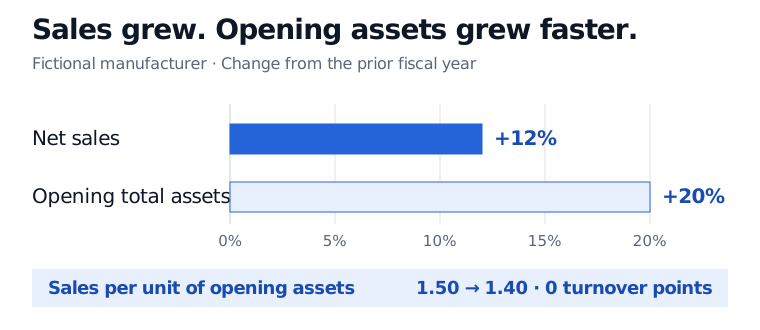
Sales can grow while turnover falls. The opening asset base grew faster than net sales.
The manufacturer earned more gross profit per unit of sales but made fewer sales per unit of opening assets. That earns one operating-efficiency point. Section 2.3.3 of the paper uses opening assets for turnover, while Table 1’s note j describes average assets. Record the convention when reproducing or comparing screens. With average assets, turnover here still falls, from about 1.36 to 1.20. Piotroski, §2.3.3 and Table 1 note j.
Screen on what was available
For a historical rebalance, calculate the score from filings available by the decision time. Use the as-filed figures and version timestamps so a later restatement cannot create look-ahead bias. Match fiscal periods and reporting scope. Treat an unobserved issuance item or an undefined ratio as missing, and document how missing firms enter or leave the screen. A zero point represents an observed condition that failed. Piotroski required enough data to compute the signals and began measuring returns in the fifth month after fiscal year-end. Piotroski, §3.
Read the component signals alongside the total. A small gross-margin improvement earns the same point as a large one, and two six-point firms can have different financing risks. The higher-score group outperformed the lower-score group in Piotroski’s historical high-book-to-market sample. The result describes that sample and portfolio design. A live screen needs its own evidence for the universe, trading costs and any selection cutoff. Piotroski, §4.2 and Table 3.
The SelfMadeQuant filing monitor shows how to tie ratio inputs to the specific filing and replay a review queue in acceptance-time order. Its deterioration model uses a different set of signals. Financial Filing Change and Deterioration Monitor (membership).
Sources
- Joseph D. Piotroski (2000), Value Investing: The Use of Historical Financial Statement Information to Separate Winners from Losers, Journal of Accounting Research 38, 1–41. Journal article hosted by Ivey Business School.