The personal consumption expenditures (PCE) price index measures how prices change for goods and services bought by or on behalf of U.S. residents. Its percentage change measures inflation. The Bureau of Economic Analysis (BEA) publishes it alongside two measures of spending. Nominal PCE values purchases in current dollars, while real PCE measures spending volume after adjusting for prices. BEA PCE price index
What a 3% rise in spending buys
Suppose nominal PCE rises 3% in a fictional economy over one year, while a compatible aggregate PCE price index rises 2%. Set both indexes to 100 in Year 0. In Year 1, the nominal spending index is 103 and the price index is 102. The price index acts as a deflator. Divide the spending index by the price factor to get the real volume index on the same Year 0 scale.
Real consumption grew about 0.98% over the year. The growth factors multiply, so subtracting 2% from 3% only approximates real growth. The price level of 102 is in index points. The 2% inflation rate comes from the ratio to the level one year earlier, which happens to be 100 here. The same ratio using the previous month instead measures monthly inflation. BEA release conventions
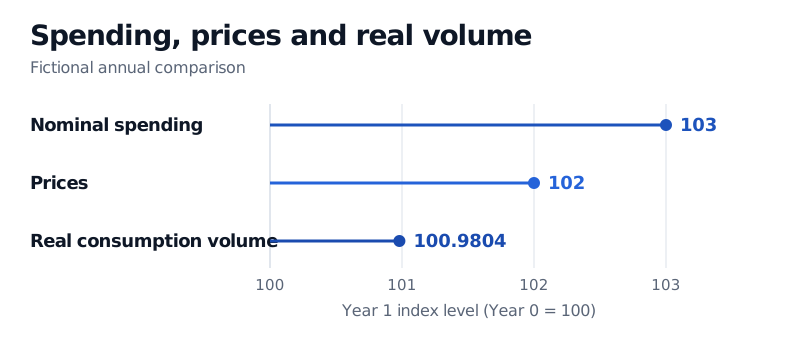
The three dots share an index scale. Deflating spending divides the nominal growth factor by the price growth factor.
BEA builds the official aggregate from detailed spending categories. A Fisher price comparison takes the geometric mean of two price relatives, one using the earlier period's quantities and the other using the later period's quantities. BEA chains adjacent-period comparisons by multiplying their growth factors, then scales the series to 100 in the reference year. The corresponding Fisher quantity and price factors multiply to the nominal spending factor for the same aggregate in an unrounded Fisher comparison. Use the published total for real PCE, because chained-dollar categories generally do not sum to it. BEA NIPA Handbook, chapters 4 and 5
Why PCE and CPI can disagree
The U.S. consumer price index for all urban consumers (CPI-U) and the PCE price index cover much of the same spending. PCE also includes purchases made on households' behalf, such as medical care paid by Medicaid, and consumption expenditures of nonprofits serving households. The two indexes can assign different weights even to categories they share. BEA uses the Fisher formula for aggregate PCE, while the Bureau of Labor Statistics uses modified Laspeyres aggregation for CPI-U with expenditure weights updated annually. Different price inputs and seasonal adjustments can also matter. BEA reconciliation · BEA definitions and scope · BLS CPI calculation
Which number goes into a macro model?
Headline and core answer different questions. In its statement reaffirmed in January 2026, the Federal Open Market Committee defines its longer-run inflation target as 2% annual inflation measured by the total PCE price index, also called headline PCE. Core PCE excludes food and energy. Policymakers track it because those prices can swing sharply, making the underlying trend harder to read in the headline series. FOMC strategy statement · Federal Reserve Monetary Policy Report
Observation month and release date answer different questions. BEA initially reported August 2026 monthly core PCE inflation at 0.2% on September 30. Its October 29 release revised that estimate to 0.3%. In a historical forecast or event study, use the release vintage available at the decision time to avoid look-ahead bias. The observation month tells you what the number describes. The release timestamp tells you when it could enter the model. BEA August release · BEA September release
The SelfMadeQuant Point-in-Time Data lesson shows how to select the version available at a given cutoff. The preview is public and the full lesson requires membership.
Sources
- BEA PCE price index and release archive
- BEA Personal Income and Outlays release conventions
- BEA NIPA Handbook, Chapter 4, Estimating Methods
- BEA NIPA Handbook, Chapter 5, Personal Consumption Expenditures
- BEA reconciliation of the PCE price index and CPI
- BLS Handbook of Methods, CPI calculation
- FOMC Statement on Longer-Run Goals and Monetary Policy Strategy, reaffirmed January 2026
- Federal Reserve Monetary Policy Report, July 2026
- BEA August 2026 Personal Income and Outlays release
- BEA September 2026 Personal Income and Outlays release