L-moments summarize distribution shape using ordered values. Work unbiased probability weights, L-skewness and L-kurtosis, and see the limits of outlier resistance.
L-moments and probability-weighted moments
L-moments describe a distribution through linear combinations of expected order statistics. Probability-weighted moments (PWMs) weight observations by their positions in the distribution; a particular PWM family generates the L-moments. For a quant comparing loss-severity distributions, they offer an alternative to cubing and taking fourth powers of losses when measuring shape.
Weight the probability, not the loss magnitude
For a continuous distribution with CDFF and quantile functionQ, the general PWM family is
Mp,r,s=E[XpF(X)r{1−F(X)}s].
Use this general family only where the powers and expectation are defined. The family used here fixes p=1 and s=0:
βk=M1,k,0=E[XF(X)k]=∫01Q(u)ukdu,k=0,1,….
Thus β0 is the mean. Higher k gives greater probability weight to the upper ranks, while X remains to the first power. This continuous-CDF identity should not be applied unchanged to a distribution with atoms. See Greenwood and colleagues' original definition.
Equivalently, writing X(j:r) for rank j in an independent sample of size r,
λr=r1k=0∑r−1(−1)k(kr−1)E[X(r−k:r)].
In particular, λ2=21E[∣X−X′∣] for independent draws X,X′. It measures spread in the same units as X, unlike a variance. Hosking's paper develops this connection.
Four losses, with the normalization exposed
Take the fictional sorted loss sample 1,2,3,10, in USD millions. Assume independent observations from one continuous loss distribution when interpreting the sample quantities as population estimators.
For n ordered observations, use the unbiased sample PWM estimator
bk=n1i=1∑n(kn−1)(ki−1)x(i),0≤k≤n−1,
with (ka)=0 when a<k. Both the outer 1/n and the denominator (kn−1) matter.
For n=4, the weights inside the sum for b1 are 0,1/3,2/3,1. Hence
b1=41(0⋅1+31⋅2+32⋅3+1⋅10)=619.
The complete calculation is:
Quantity
Exact value
Meaning
b0
4
Sample mean
b1
19/6
First probability-weighted moment estimate
b2
11/4
Second probability-weighted moment estimate
b3
5/2
Third probability-weighted moment estimate
ℓ1=b0
4
Sample L-location
ℓ2=2b1−b0
7/3
Sample L-scale
ℓ3=6b2−6b1+b0
3/2
Third sample L-moment
ℓ4=20b3−30b2+12b1−b0
3/2
Fourth sample L-moment
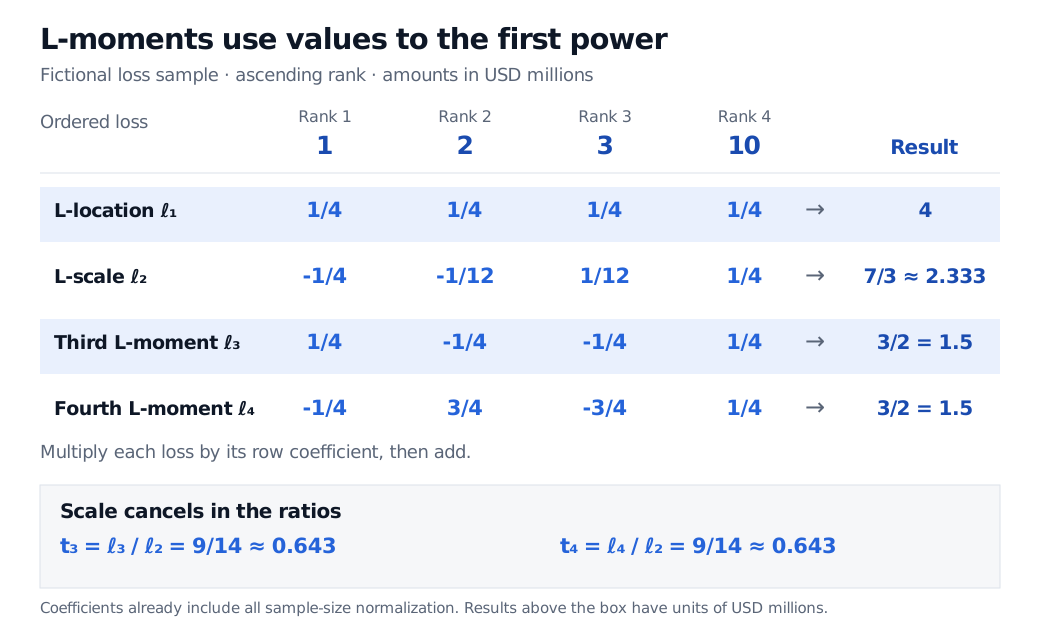
All eight entries have units of USD millions. The sample L-moments can also be calculated directly from the signed rank coefficients below.
Coefficient grid for fictional ordered losses of 1, 2, 3 and 10 USD millions. The rows produce sample L-moments of 4, 7/3, 3/2 and 3/2 USD millions. Sample L-skewness and L-kurtosis both equal 9/14, approximately 0.643.
Original fictional sample. Multiply each ordered loss by its row coefficient and add; the bottom panel divides the third and fourth L-moments by L-scale.
Using Fn(x(i))=i/n instead would give the plug-in estimate 41∑ix(i)(i/4)=27/8 for β1, rather than 19/6. These are different finite-sample estimators. The combinatorial estimator corresponds to averaging order-statistic contrasts over all subsamples, as in Hosking's §3.1.
L-skewness and L-kurtosis are different scales
For a nonconstant population, define
τ3=λ2λ3,τ4=λ2λ4.
Their sample versions give
t3=ℓ2ℓ3=149≈0.643,t4=ℓ2ℓ4=149≈0.643.
These dimensionless ratios are called L-skewness and L-kurtosis. Conventional skewness uses a third central moment divided by standard deviation cubed; conventional kurtosis uses a fourth central moment divided by variance squared. Their values are not interchangeable with τ3 and τ4. In particular, subtracting three from L-kurtosis does not turn it into conventional excess kurtosis.
A software detail can otherwise create a misleading comparison: Hosking's R package lmom returns ℓ1,ℓ2,t3,t4 by default from samlmu, while ratios=FALSE returns ℓ1,ℓ2,ℓ3,ℓ4. Check the official function documentation before treating its third and fourth outputs as amounts.
What the extra stability buys—and what it cannot
The untrimmed population L-moments exist when E[∣X∣]<∞, even if variance or higher conventional moments fail to exist. Existence alone does not give finite estimator variance or justify a normal confidence interval. Unbiased bk and ℓr also do not make their ratios unbiased.
Less sensitivity to extremes is useful for distribution fitting, but it is not outlier immunity. In this very sample, replace the largest loss by M≥3. Then
ℓ1=4M+6,ℓ2=123M−2.
Both grow without bound. A data error can still dominate untrimmed L-location and L-scale. If all observations are equal, ℓ2=0 and the shape ratios are undefined. Trimmed L-moments are a separate family, explicitly distinguished in the package documentation.
For fitting, the method of L-moments matches sample L-moments to those of a chosen distribution, paralleling the ordinary method of moments. It still requires a defensible distribution family and a sampling design; four illustrative losses cannot validate an extreme loss forecast.
For the underlying rank notation and sampling distributions, Order Statistics and Sample Quantiles develops order-statistic densities and contrasts the behaviour of means and medians. A public preview is available; the full lesson requires membership.