Value a dividend-paying share when growth fades steadily, and compare the H-model shortcut with an annual dividend forecast.
H-model dividend valuation
The H-model is a dividend discount model that approximates today's share value when dividend growth moves in a straight line from its current rate to a stable rate and then stays there. An analyst can use it to estimate how much temporary fast growth adds to a dividend payer's value as its market matures. Fuller and Hsia, A Simplified Common Stock Valuation Model
How much is the faster growth worth?
Suppose an established testing-equipment maker just paid its annual dividend of USD 2 per share. It has been expanding its service network quickly, but the analyst expects new contracts to become harder to find as the network fills out. The analyst starts the forecast at 8% dividend growth, lets it fade steadily to 3% over eight years and assumes 3% forever after that. Dividends are nominal, paid at year-end and discounted at a constant 9% annual effective required equity return.
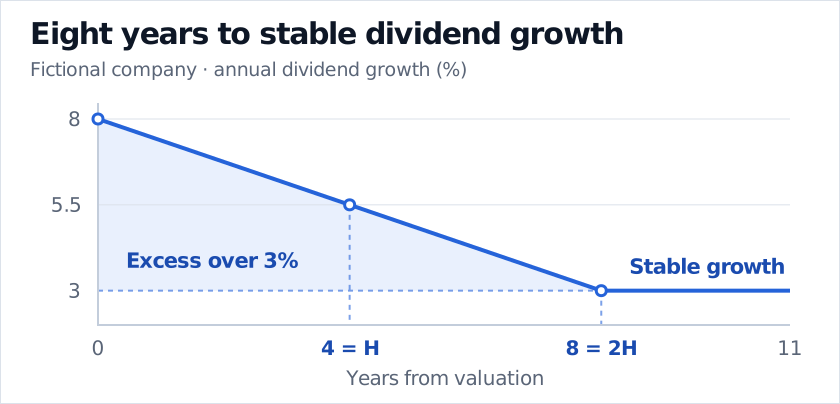
Annual dividend growth for a fictional company falls in a straight line from 8% today to 5.5% at year four and 3% at year eight, then stays at 3%. The triangle above 3% is shaded during the eight-year fade.
The eight-year fade gives H = 4 years. The shaded area represents growth in excess of the 3% stable rate.
Let D0 be the dividend per share just paid, r the required equity return, gS the starting growth rate and gL the stable growth rate. The transition lasts 2H years, so H is its half-length. For r>gL, the H-model estimates the value in USD per share as follows. Damodaran, Valuation Approaches and Metrics, pp. 12–13
The USD 34.33 comes from the Gordon growth model applied as if 3% growth began immediately. The USD 6.67 is the estimated increment from the fade. Along the straight line, the excess over 3% averages half the initial gap. The shaded triangle therefore has area H(gS−gL). The H-model uses that area to summarise the extra growth in one term. If the two rates coincide, the adjustment vanishes.
Check the shortcut against dated dividends
To calculate the value of a particular annual cash-flow forecast, choose when each growth rate applies. For this example, use the midpoint of each of the first eight years. In year t, take gt=gS−(gS−gL)(t−21)/8 and compound Dt=Dt−1(1+gt). In year nine the dividend grows at 3% from D8, giving D9≈3.1591 USD per share.
V0=t=1∑81.09tDt+1.098D9/(0.09−0.03)≈40.72.
The sum includes the year-eight dividend. The terminal value is dated at year eight and starts with the year-nine dividend. That split belongs to the explicit forecast. The USD 41.00 shortcut already values the full stream, including the stable-growth years. The difference comes from compounding and discounting the transition year by year in the explicit forecast. CFA Institute, Discounted Dividend Valuation
The shortcut fits a business with an established dividend policy and a plausible smooth fade. An annual forecast can represent a scheduled payout change or a stretch of high growth before the fade. In either approach, a small spread between the required return and stable growth makes the value especially sensitive to those estimates. Damodaran, Valuation Approaches and Metrics, pp. 12–13
Section 4 of the SelfMadeQuant lesson shows how to date the terminal equity value in a three-stage forecast. The preview is public and the full lesson requires membership. Equity Valuation: Dividend Discount and DCF Models