How delayed counterparties and finite risk-bearing capacity create temporary price pressure, with a clearly separated CARA-normal risk-sharing example.
Grossman–Miller model
The Grossman–Miller model explains liquidity through the supply and demand for immediacy: trading now rather than waiting for an eventual counterparty. Its practical consequence is that a sale can depress price without conveying bad news, because someone must bear price risk during the wait.
The missing buyer arrives later
In Grossman and Miller’s 1988 model, sellers arrive before the offsetting buyers. Market makers bridge that gap by holding inventory. A seller pays for shedding interim price uncertainty through a price concession. More risk-bearing capacity reduces that concession, other things equal.
The original model has three dates: an initial imbalance, later arrival of offsetting customers, and terminal valuation. Public news can change value between dates, so temporary selling pressure implies an expected recovery, not a guaranteed rebound. In the long run, entry balances the utility benefit of making markets against the cost of remaining available. See the original paper, overview and §I.
Isolating the price of carrying risk
Here is an original reduced one-period illustration, not a numerical solution of the paper’s full equilibrium. Suppose customers have already chosen to sell Q=100 shares immediately, and M=5 identical, initially flat dealers absorb the entire quantity equally.
Assume zero interest, no fees or hedges, unrestricted positions, and a normally distributed later resale value V. Conditional on current information,
E[V]=μ=100,Var(V)=σ2=4.
Values are USD per share, so variance is in squared USD per squared share; resale standard deviation is USD 2 per share. Each dealer has exponential utility U(W)=−e−γW with constant absolute risk aversion γ=0.01 per USD. There is no information advantage in the sale.
For a purchase of q shares at price p, incremental terminal wealth is q(V−p). Under these normal and exponential-utility assumptions, maximising expected utility is equivalent to maximising the certainty equivalent
q(μ−p)−2γq2σ2.
The first-order condition gives the dealer’s optimal holding:
q=γσ2μ−p.
Competitive clearing requires Mq=Q, hence
p=μ−γσ2MQ.
This is a marginal clearing price. It is not the price that makes a dealer indifferent between buying the whole block and buying nothing; that would compare total certainty equivalents rather than set marginal demand.
Fixed dealer count
Inventory per dealer
Concession from conditional mean
Clearing price
5
20 shares
USD 0.80/share
USD 99.20/share
10
10 shares
USD 0.40/share
USD 99.60/share
For five dealers, the discount is 0.01×4×20=0.80. Doubling the dealer count halves each dealer’s exposure while keeping preferences and resale uncertainty fixed.
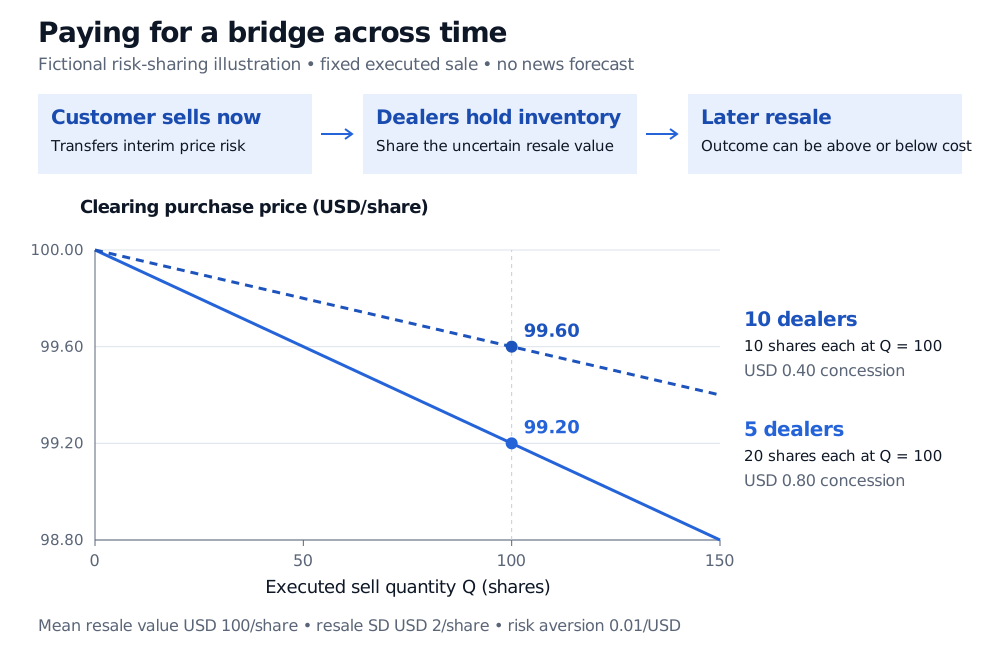
Fictional fixed-quantity CARA-normal illustration. For a 100-share sale, five dealers hold 20 shares each and pay USD 99.20 per share; ten hold 10 each and pay USD 99.60. The mean resale value is USD 100 and its standard deviation is USD 2 per share.
Original reduced risk-sharing illustration. Solid and dashed lines compare fixed dealer counts; they are quantity schedules, not realised price paths or the full three-date equilibrium.
The first dealer’s expected gross trading profit is 20(100−99.20)=16 dollars. If resale instead occurs at USD 98, its result is 20(98−99.20)=−24 dollars. The concession compensates for inventory risk; the conditional mean is not an executable future sale price.
What the reduction leaves out
The paper’s date-1 customer also optimises how much to sell now. With M makers and initial desired imbalance i, each maker holds i/(M+1) and total immediate customer sales are Mi/(M+1) under its symmetric assumptions (§I.A, equations 11–14). Our Q is that executed quantity, fixed externally. The denominator M follows from this different choice of input. We also fix dealer count instead of solving entry, and replace the paper’s two-stage valuation and information structure with one normal resale value. Our variance of 4 describes that resale value; the paper’s date-1 risk concerns its date-2 price P2=E2[P3], rather than the terminal price P3 directly.
The resulting USD 0.80 concession is therefore neither an estimate for an actual stock nor a literal bid-ask spread. No simultaneous two-sided quote was specified. Price pressure, quoted width and realised dealer profit require different measurements.
For empirical work, a post-sale reversal is consistent with this mechanism but does not identify it: public news, other orders and the chosen observation horizon also affect prices. The Market Impact lesson develops that measurement problem and the missing no-trade counterfactual. Its public page is a preview; the full lesson requires membership.
Sources
Sanford J. Grossman and Merton H. Miller (1988), Liquidity and Market Structure, Journal of Finance 43(3), 617–633. Overview pp. 618–619; §I pp. 622–628 covers timing, customer choice, risk bearing and entry; §II.A–B pp. 628–630 discusses limits of spread and volume-based liquidity measures. The worked numbers and figure above are original.