Compare forward earnings yield with nominal bond yield, calculate mechanical parity, and understand why the gap is not a fair value or promised equity return.
Fed model
The Fed model is a stock-market valuation heuristic that compares an equity index's earnings yield, annual earnings divided by price, with a long-term nominal government bond yield, commonly the ten-year U.S. Treasury yield. Its simplest rule calls equities relatively cheap when earnings yield exceeds bond yield. For a quant, the practical question is whether that spread predicts future returns after accounting for what each yield measures.
The name does not mean Federal Reserve endorsement. The Fed's July 1997 report discussed twelve-month-ahead earnings relative to prices alongside ten-year Treasury yields; that historical comparison was not a prescribed valuation identity. The San Francisco Fed explicitly distinguished the popular rule from an endorsed Fed model in 2004. 1997 report, 2004 Economic Letter.
One percentage point, and a tempting price target
Let E1 be forecast earnings per index unit over the next twelve months, P0 the current index level, and yN the annual nominal government-bond yield. The simple comparison is
Earnings yield=P0E1,Yield gap=P0E1−yN.
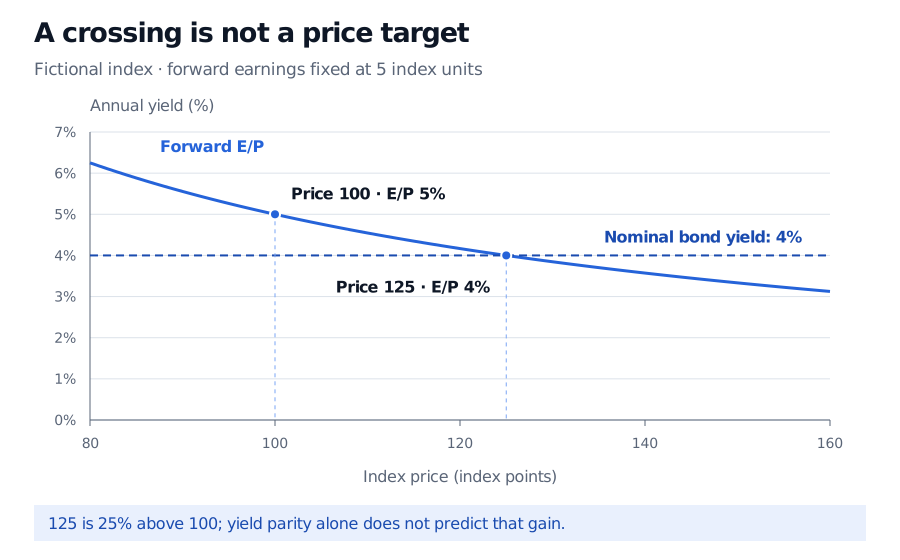
Consider a fictional index at 100 with forward earnings of 5 index units and a nominal bond yield of 4%. Its forward earnings yield is 5/100=5%, so the gap is 1 percentage point, or 100 basis points.
Imposing the heuristic's equality gives
Pparity=yNE1=0.045=125.
That is 25% above 100. It is the price that makes two ratios equal while holding both earnings and bond yield fixed. It is neither an intrinsic-value calculation nor a forecast of a 25% gain. A fall in expected earnings from 5 to 4 would instead erase the gap at the unchanged price of 100.
With forward earnings fixed at 5 index units, earnings yield falls from 5% at index price 100 to 4% at price 125, crossing the constant 4% nominal bond yield.
Fictional comparison: the curve changes only the index price. The crossing at 125 is mechanical yield parity, not an estimated future price.
Declare the earnings convention before computing: forward means forecasts for a specified future period; trailing means realised earnings over a past period. They can produce different spreads at the same price. Use consistent index aggregation, accounting basis, currency, observation date and annual earnings period; do not splice trailing reported earnings into a forward operating-earnings history. The one-year earnings window and ten-year bond maturity remain different economic horizons even though both ratios are quoted annually.
The conventional positive-earnings interpretation requires P0>0 and E1>0. Zero earnings or losses do not produce a useful “cheap versus expensive” P/E comparison. A positive finite parity price also requires yN>0; a zero yield makes division undefined, and a negative yield produces no positive-price crossing with positive earnings.
A ratio of profits is not a bond coupon
Accounting earnings are not cash distributed to shareholders. A fixed-rate nominal Treasury promises specified nominal payments; equity distributions depend on future business outcomes and payout policy. Neither the 5% earnings yield nor the 1-point gap is a promised holding-period return. Selling a bond before maturity also introduces price risk.
A simple dividend-discount calculation exposes what the equality leaves out. Suppose next year's dividend is a constant fraction q of next year's earnings, dividends then grow at constant annual rate g forever, and the equity required return is k>g. Then
P0=k−gqE1⟹P0E1=qk−g,q>0.
There is no general reason for (k−g)/q to equal a Treasury yield. The yield gap is not itself an estimate of the equity risk premium. Payout, growth and the equity risk premium all matter. This is an illustration under restrictive constant-growth assumptions, not a replacement estimate for the fictional index.
A nominal bond yield incorporates expected inflation as well as real-rate and risk components. Corporate nominal earnings can also change with inflation, so lowering a nominal discount rate while leaving nominal cash-flow growth unchanged can misstate value. Earnings yield is a valuation ratio, not a guaranteed real return; firms do not pass inflation through perfectly. Replacing the nominal bond yield with a real interest rate still does not resolve payout differences or equity risk. Lansing's 2004 discussion explains these distinctions.
Asness's 2003 critique separates describing observed valuations from predicting subsequent returns. His historical tests found that subtracting nominal bond yield did not improve long-horizon real-equity-return forecasts in the way the simple rule requires. That is evidence against treating parity as a law, not a universal claim that interest rates never affect equity prices. Fight the Fed Model.
A researcher can retain the gap as a clearly defined candidate signal. Testing a trading rule still requires earnings forecasts actually available at each date, a specified investment horizon, an out-of-sample test, and returns after trading costs. A visually persuasive yield comparison alone establishes neither a reliable rotation strategy nor guaranteed returns.
Clifford S. Asness, Fight the Fed Model, The Journal of Portfolio Management 30(1), Fall 2003, pp. 11–24. Definition, valuation critique and historical forecasting tests.