Explainable AI makes model behaviour understandable for a specified audience and task. Separate intrinsic and post-hoc methods, local and global scope, and accounting from evidence.
Explainable artificial intelligence
Explainable artificial intelligence (XAI) is the set of methods and evaluation practices used to make an AI system's behaviour understandable to a specified audience for a specified task. In quantitative finance, an explanation can help an analyst investigate why a credit model raised a risk score or why a forecasting model relies on a suspicious input. It cannot, by itself, establish that the forecast is accurate, economically causal or tradable.
The words interpretability and explainability have no universal boundary. Here, interpretability means the ability to understand relevant model behaviour; an explanation is a representation offered to support that understanding. A readable story is useful only if it answers the right question and is supported by evidence. Doshi-Velez and Kim make the evaluation task central, rather than treating interpretability as a single model score.
Can we inspect the computation itself?
An intrinsically interpretable model has a structure that exposes its relevant computations: for example, a short rule list or a sparse additive model with meaningful inputs. Its explanation can follow the actual prediction path. Simplicity is audience-dependent: a linear formula with thousands of transformed inputs may be difficult to understand despite its familiar model class.
A post-hoc explanation is constructed after fitting a predictor. It may approximate the predictor, attribute an output to inputs, or probe a learned representation. The explanation and the predictor are different objects, so their agreement needs checking. Rudin's discussion emphasises this distinction and motivates considering an interpretable predictor before accepting the burden of explaining a complex one. Neither model family has an automatic accuracy advantage on every financial dataset.
Are we explaining this prediction or a population?
A local explanation concerns a particular input and a stated neighbourhood or reference. A global explanation concerns behaviour across a defined input domain or population. These are separate from the intrinsic/post-hoc distinction: an interpretable model may expose both its overall rule and one observation's path through it; a post-hoc method may produce either local or global summaries.
For a single flagged borrower, LIME asks which simple surrogate approximates the predictor nearby. Its neighbourhood, sampling scheme and approximation error matter. SHAP values instead allocate a prediction relative to a specified reference and definition of missing features. A reconciled attribution is not a universal answer to “why”.
If the analyst asks when the model will keep issuing the same flag as other inputs vary, an anchor explanation supplies conditions with high conditional model agreement under a chosen distribution. Agreement with the predictor is distinct from correctness about eventual defaults.
A portfolio-wide summary of local attributions answers another question again. Averaging absolute contributions can describe which inputs receive large allocations in that sample, but discards direction and can hide different subpopulations. It does not turn each local explanation into a global decision rule.
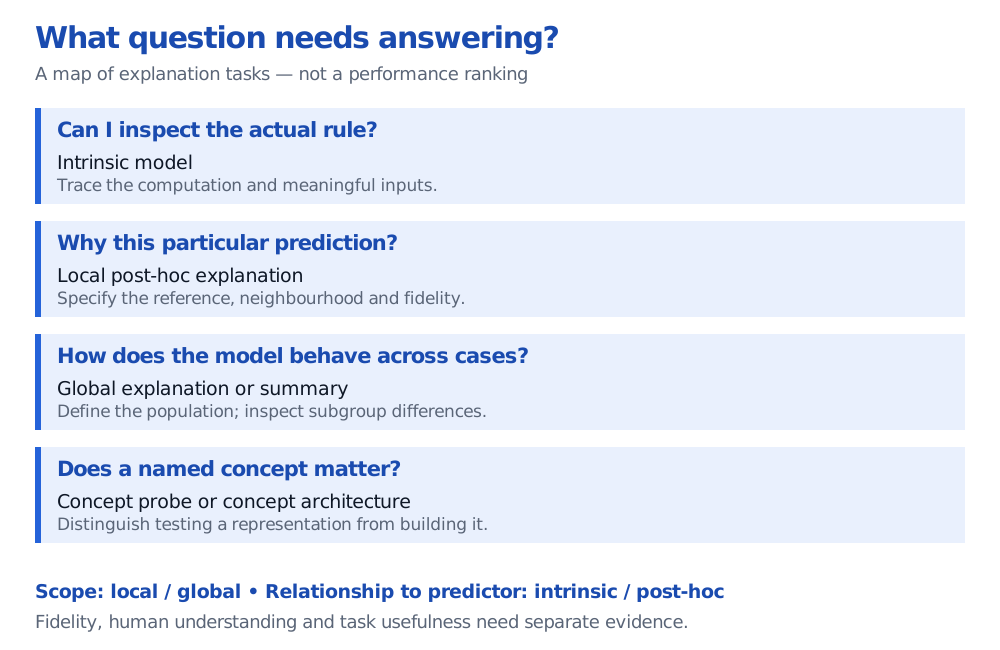
Four explanation questions: inspect the computation with intrinsic models; approximate one prediction with local explanations; describe behaviour over a specified population with global summaries; test concepts with TCAV or build a concept bottleneck. These are different questions, not performance rankings.
Choose the question before the explanation. Local and global describe scope; intrinsic and post-hoc describe the relationship to the predictor. No empirical method comparison is shown.
What does an attribution total actually prove?
Consider a stipulated accounting illustration, not a fitted model. The output is a dimensionless risk score, not a calibrated default probability or a log-odds value. The declared reference is a fictional background portfolio with average score 0.30. Suppose a reporting convention assigns the selected borrower contributions of 0.40 for leverage and 0.10 for past-due status:
0.30+0.40+0.10=0.80.
The contributions reconcile the displayed score to its reference. That arithmetic alone does not identify a unique allocation: 0.25 and 0.25 would also sum to the same 0.50 difference. Neither pair is asserted to be a SHAP result. SHAP's uniqueness statement requires additional axioms and a fixed feature-value construction; it does not follow from summation alone. See Lundberg and Lee, §§2–4.
Reconciliation at one point also says nothing about agreement at neighbouring inputs. Nor does the leverage allocation imply that reducing leverage would lower this borrower's realised default risk by 0.40. Dependence between financial inputs, the reference population and the treatment of missing features affect what the allocation means.
Do we need features, derivatives or economic concepts?
For a differentiable model, gradient saliency asks which input directions change a selected score locally. Integrated gradients accumulates derivatives along a path from a chosen baseline. A sensitivity and a baseline-relative attribution answer different questions; neither establishes a causal intervention in the economy.
For a document classifier, an analyst might instead ask whether the model responds to a concept such as refinancing pressure. TCAV probes a trained network using example-defined directions in its hidden representation. A concept bottleneck model changes the architecture: predictions pass through named intermediate concepts that can be inspected and edited. Testing a concept direction after training and designing a prediction pathway through concepts are materially different choices. Names alone do not guarantee that the learned quantities capture the intended meaning.
What evidence would make this useful?
Keep three questions separate:
Fidelity: does the explanation represent the predictor's behaviour on the inputs and scope claimed? Test agreement or approximation error using a defensible reference and perturbations.
Interpretability: can the intended reader understand the representation? A short formula is not helpful if its inputs are opaque.
Task usefulness: does it help that reader do the actual job, such as locating an invalid feature or predicting when a model flag will change? Evaluate that task, rather than satisfaction with the explanation alone.
For example, a large allocation to “latest earnings” should prompt a timestamp investigation. If the historical feature contains a revision published after the forecast date, the explanation may help locate the defect while faithfully explaining an invalid predictor. The Point-in-Time Data lesson, which requires membership, develops the release-date and revision audit. Explanation does not repair the information set or replace time-ordered forecast evaluation.
Record the question, audience, model version, output scale, reference data and explanation settings together. A model developer debugging inputs, a risk analyst reviewing a flag and a portfolio manager assessing exposures may need different representations of the same predictor.