Understand the historical return premium around scheduled earnings, how announcement timestamps define exposure, and why it differs from surprise strategies, drift and option pricing.
Earnings announcement premium
The earnings announcement premium is the tendency for stocks to earn higher average returns during periods when firms are expected to announce earnings than during comparable non-announcement periods. For a quant, the research question is whether an announcement calendar known before trading predicts returns from bearing exposure around the release, without first knowing whether earnings will beat or miss expectations.
“Unconditional” here means not sorted on the earnings surprise. The return comparison still conditions on whether an announcement is expected. A premium is an average effect, so an individual announcement can produce a large loss.
What is being held, and when?
The calendar must exist before the position. A realised announcement date downloaded after the fact can support a descriptive event study, but does not establish that a trader could have selected that date beforehand. Early releases, delays and cancellations make this distinction consequential.
Frazzini and Lamont's December 2006 working paper explicitly separates expected from actual announcement dates. Its principal calendar-time tests form portfolios using expected announcement months, with the main Compustat-based return sample covering 1973–2004. A monthly result and an announcement-day result concern different holding windows; they cannot be substituted for one another. See Sections I.B and II.
A reproducible daily specification might use this fictional clock, all in UTC−04:00, with ordinary sessions opening at 09:30 and closing at 16:00:
Item
Timestamp or rule
Schedule version available to the researcher
Tuesday 27 October 2026, 14:00; release expected after Wednesday's close
Position window fixed using that schedule
Wednesday 28 October close to Thursday 29 October close
Actual public release timestamp, retained for attribution
Wednesday 28 October, 16:10
Return decomposition
Wednesday close to Thursday open, then Thursday open to Thursday close
This is a stipulated timing example, not an exchange calendar or a claim of obtainable closing fills. A trading implementation must submit eligible orders before the relevant cutoff and record execution prices. If the release is postponed, retain or exit the scheduled position according to an advance rule; do not silently move its entry to the eventual release date. Keep the original schedule version and later updates to avoid look-ahead bias.
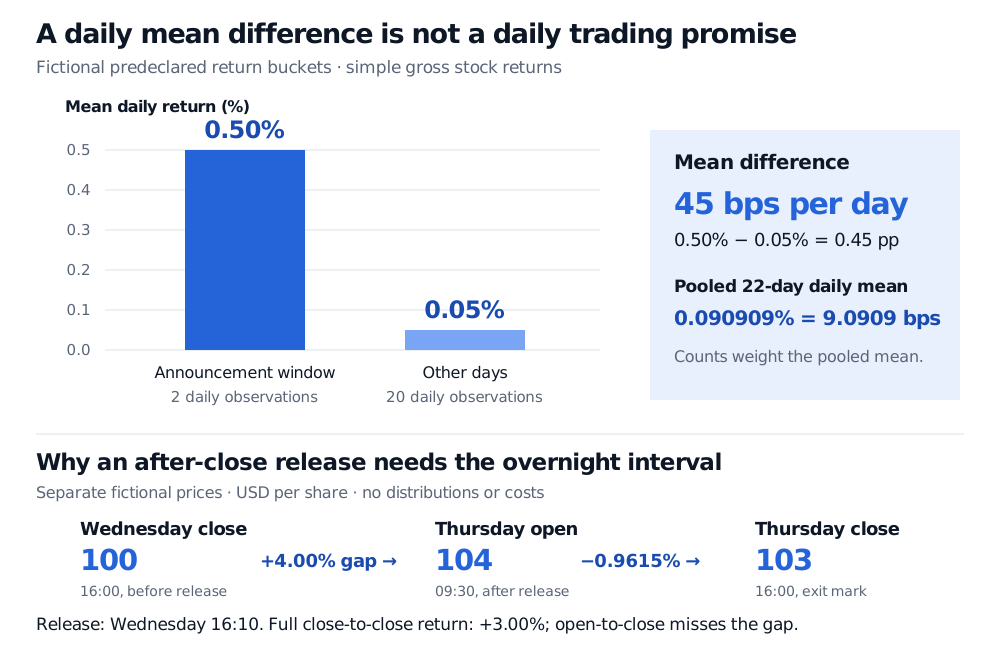
Suppose separate fictional prices are USD100 at Wednesday's close, USD104 at Thursday's open and USD103 at Thursday's close, with no distributions. The overnight return is +4%, the next open-to-close return is −0.9615%, and the full close-to-close return is +3%. Buying only at Thursday's open misses the announcement gap. The intervals reconcile multiplicatively:
(1+0.04)(1−1041)−1=0.03.
Reading the premium's units
Let A=1 denote a daily return interval selected by the predeclared announcement-window rule and A=0 a comparison interval of the same length. A simple population comparison is
Δ=E[R∣A=1]−E[R∣A=0].
An empirical estimate replaces the expectations with sample means. Specify whether R is raw total return, return above cash, or abnormal return relative to a fitted benchmark. Those choices answer different questions. Even with a benchmark, a positive difference does not identify a causal effect of announcing: the firms, calendar dates and risks can differ across buckets.
Consider two fictional announcement-window daily observations averaging 0.50% and 20 other daily observations averaging 0.05%. Their mean difference is
Δ=0.50%−0.05%=0.45 percentage points=45 basis points per day.
Pooling the observations gives a different quantity:
Rˉ=222(0.005)+20(0.0005)=0.00090909…=0.090909…% per day.
Fictional daily means: two announcement-window observations average 0.50%, twenty other observations average 0.05%; difference 45 basis points per day and pooled daily mean 0.090909%. Separate USD prices 100, 104 and 103 give a 4% overnight gain, a 0.9615% intraday loss and a 3% close-to-close gain.
Original fictional daily-bucket arithmetic and a separate after-close price example. Returns are simple and gross of costs; the buckets are illustrative, with no significance estimate or market calibration.
The pooled mean weights each bucket by its observation count. It is neither the premium nor a compounded holding-period return. Multiplying 45 basis points by 252 would assume access to the same incremental exposure every trading day; this sparse announcement example supplies no such strategy. The means and counts alone also give no estimate of standard error.
Nearby earnings trades answer different questions
Concept
Information or exposure that defines it
Earnings announcement premium
Scheduled announcement exposure, averaging across positive and negative surprises
Earnings surprise strategy
A directional signal based on earnings relative to an expectation; realised surprises become usable only after release
Post-earnings-announcement drift
Subsequent returns related to the earnings news already released
Option event-risk pricing
The price charged for option exposure to the release, often visible in implied volatility
An elevated stock-return average does not establish that buying or selling an earnings straddle is profitable. Option results also depend on the paid premium, the realised move, volatility repricing, hedging and costs. Likewise, a broad window can contain post-release returns without making the calendar premium identical to a surprise-sorted drift strategy.
A pattern with competing explanations
Frazzini and Lamont connect the historical premium to announcement-related volume and imputed small-investor buying, offering an attention-based explanation. Savor and Wilson's December 2011 working paper instead develops a risk mechanism: individual firms' announcements convey information about aggregate cash flows, increasing announcers' exposure to fundamental news. Their Introduction and Section I explain why ordinary market beta need not capture that exposure. These are competing economic interpretations, not proof that a calendar entry mechanically causes a positive return.
Before treating a historical gross pattern as an implementable signal, preserve point-in-time schedules, tradable-universe and missing-data rules, distributions and delisting returns. Account for overlapping earnings seasons and repeated firms in inference; simultaneous guidance or other announcements complicate attribution. Evaluate jump losses, spreads, execution, turnover, financing and any stock-borrow costs on the actual holdings. Diversification does not eliminate common announcement risk. Historical evidence alone establishes neither present-day net profitability nor a risk-free trade.
For further study, Event Definition explains event selection and confounding releases, while Expected-Return Models compares return benchmarks. Both have public previews; full lessons require membership.
Sources
Andrea Frazzini and Owen A. Lamont, The earnings announcement premium and trading volume, working draft dated 6 December 2006. Sections I.B, II and III distinguish forecast dates, holding windows and the volume interpretation. Historical research, not a current performance estimate.
Pavel Savor and Mungo Wilson, Earnings Announcements and Systematic Risk, working draft dated December 2011. Introduction and Section I develop the aggregate-information risk explanation. This article cites that specific draft, not a later version's numerical estimates.