Debt capacity is how much a borrower can carry under a given payment schedule, cash-flow outlook and set of borrowing constraints. Coverage-based debt sizing works backwards from a minimum coverage ratio to the largest payment that ratio permits, then converts that payment into a loan amount using the proposed interest rate and repayment terms. The result can change even if the borrower’s earnings stay the same.
Two tests, two debt ceilings
Take a fictional borrower with annual EBITDA of USD 60 million. The agreement requires at least 3.0× EBITDA to cash interest and at most 3.5× gross debt to EBITDA. Assume the new loan is the only debt, the full balance is outstanding for the year, and the fixed annual cash interest rate is 8%, with zero fees and other interest. The two coverage and leverage ratios give separate limits, in USD millions.
| Test | Implied limit |
|---|---|
| EBITDA ÷ cash interest ≥ 3.0× | Annual cash interest can be at most . At 8%, that supports of debt. |
| Gross debt ÷ EBITDA ≤ 3.5× | Debt can be at most . |
With a fixed annual rate and the balance outstanding throughout the year, cash interest is . That is what lets us divide the interest budget by the rate. The borrower must satisfy both tests, so 210 million binds at 8%. If the proposed fixed rate were 10% instead, the same interest budget would support 200 million and interest coverage would bind. The switch happens at about 9.52%, where is the rate that makes the two limits equal.
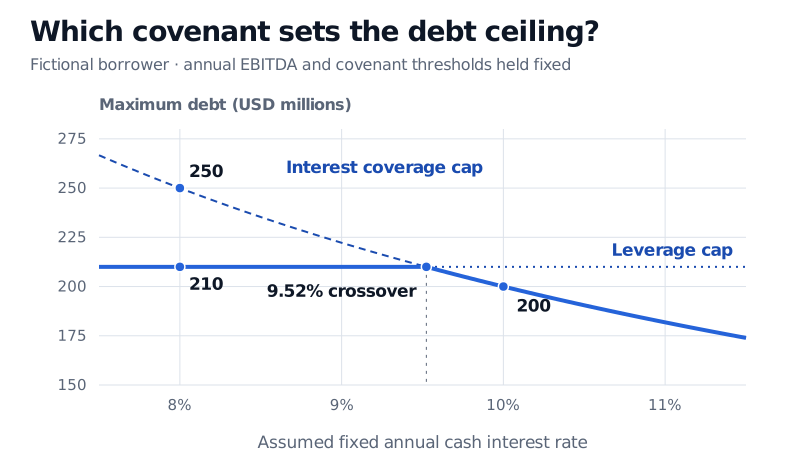
The solid line takes the lower of the two caps. Above the crossover rate, interest coverage limits the size of the loan.
Can the borrower make the payment?
At 210 million, annual cash interest is 16.8 million and EBITDA covers it about 3.57×. Now add a scheduled principal payment of 10 million at year-end, after the year's interest has accrued. The two sizing tests still pass. If slower collections leave only 24 million of cash available for debt service by year-end and there is no other liquidity, the borrower is 2.8 million short of the 26.8 million due.
A debt-service coverage ratio can capture the principal obligation by comparing cash available for debt service with interest plus scheduled principal. A dated cash forecast goes further. Cash taxes, maintenance spending and cash tied up in inventories or receivables reduce the cash available to pay lenders. A payment can fall due before customer cash arrives even in a year with positive cash flow. Amortisation reduces the balance on which later interest accrues, while a lump sum at maturity concentrates the funding need. For floating-rate debt, higher rates can raise the next payment before weaker earnings show up in a trailing covenant test.
What the credit agreement measures
Covenant calculations depend on the agreement’s definitions, including which EBITDA add-backs are allowed, which interest charges qualify, how much cash can be netted against debt and when the test applies. Knowles’ 2023 agreement defines cash interest around amounts paid during the test period, including payments that relate to prior or future periods. Its September 2026 filing describes quarterly testing using four quarters of earnings and interest, along with a cap on the cash deducted for total net leverage. Knowles credit agreement, §§1.01 and 6.11–6.12, Knowles September 2026 Form 10-Q, Revolving Credit Facility
A fixed-charge test can measure a broader set of payments. The compliance worksheet in Galaxy Gaming’s July 2026 amendment, for example, lists deductions for unfinanced capital spending, cash taxes and dividends above the line, and uses scheduled principal and cash interest below it. These definitions determine how much debt the covenant tests allow. Cash on hand and forecast receipts at each payment date determine whether the borrower can service that debt. Galaxy Gaming and BMO Bank, July 2026 amendment, Schedule I