An out-of-sample to in-sample performance-rate comparison, with explicit annualisation, capital, aggregation and denominator caveats.
Walk-forward efficiency ratio
The walk-forward efficiency ratio (WFE) compares a strategy's out-of-sample performance rate with its fitted in-sample rate. Under the convention used here, it is annualised out-of-sample net return divided by annualised in-sample net return. It helps a quant describe how much the measured return rate changed after parameter selection. It does not establish that the strategy is profitable, statistically reliable or ready to trade.
In walk-forward analysis, parameters are selected using an earlier in-sample (IS) window, frozen for the following out-of-sample (OOS) window, and then refitted as time advances. WFE is a diagnostic of those results, rather than the validation procedure itself. TradeStation's Walk-Forward Summary documentation describes the comparison in terms of annualised IS and OOS returns.
Fix the units before taking the ratio
Write the declared annualised net return rates as aIS and aOOS. Then
WFE=aISaOOS,aIS=0.
A ratio of 0.5 is displayed as 50%. Both inputs must use the same return definition, cost treatment and capital basis. Annualising a Sharpe ratio on one side and a return on the other does not produce this measure. A ratio of two Sharpe ratios is a different diagnostic even if software gives it a similar label.
For the fictional fixed-capital example below, define annualised return as net P&L divided by the same reference capital C and elapsed years Y:
a=CYnet P&L.
This is a linear annualisation of a fixed-capital P&L rate, with no reinvestment. An IS run earns USD 60,000 on USD 100,000 reference capital over two years: aIS=30%. Its following one-year OOS run earns USD 15,000 on the same capital basis: aOOS=15%. Hence
WFE=0.300.15=0.5=50%.
The OOS annual profit rate was half the fitted annual profit rate. The ratio is not the fraction of total IS profit retained: the raw dollar ratio is 15,000/60,000=25%, because the two windows have different durations. It is also not a 50% chance of success.
Pardo's original formulation uses annualised dollar P&L rather than a universally specified compounded percentage return. Dividing both dollar rates by the same fixed capital gives the same ratio; changing capital denominators can break that equivalence. If a report instead uses compound annual growth rates, state that choice explicitly. Linear profit rates and compound growth rates must not be silently interchanged.
The denominator can reverse the story
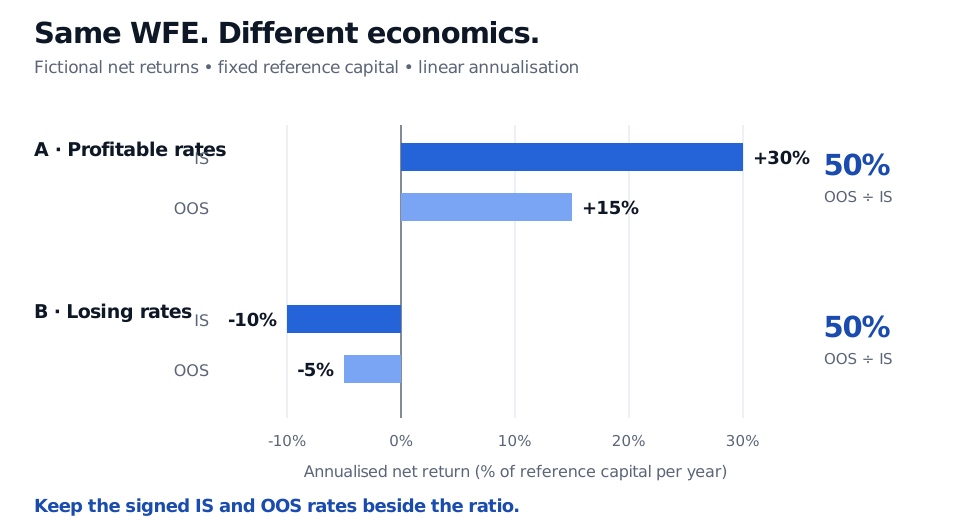
Two fictional cases on a common annualised fixed-capital net-return scale: IS plus 30% and OOS plus 15%, versus IS minus 10% and OOS minus 5%. Both produce WFE of 50%.
Both ratios equal 50%, but only the first case has positive return rates. Fictional examples; linear annualisation on a fixed reference capital.
With IS at −10% and OOS at −5%, WFE is again 0.5. Both rates describe losses. Treating the positive ratio as successful preservation of an edge would misread sign cancellation.
With a positive IS rate and a negative OOS rate, WFE is negative. The reverse sign pattern also produces a negative ratio, despite describing improvement from losses to gains. Always report both signed inputs.
At an IS rate of zero, the ratio is undefined. Near zero it is unstable: an OOS rate of 1% divided by an IS rate of 0.1% gives WFE of 10, or 1000%. The arithmetic is correct, but the denominator magnifies a small absolute difference. Report an undefined or economically unhelpful ratio as such; do not replace it with a fabricated zero or a quality score.
Combining windows requires another decision
A mean of window-level ratios, a ratio of aggregated annual profit rates and a ratio based on a linked OOS equity path are not automatically equal. Document the aggregation, window lengths, weighting and any exclusion of nonpositive IS cases. Overlapping IS windows represent repeated fitting experiments; they are not one investable chronological equity path.
For an OOS equity-linked report with no external cash flows, two consecutive nonoverlapping fold returns of +10% and −5% compound to
(1.10)(0.95)−1=4.5%.
Their arithmetic mean is 2.5% per fold, not the combined return. Annualising the linked 4.5% additionally requires the total elapsed time. This is a separate reporting convention from the fixed-capital profit-rate example above; stitching returns does not by itself specify the IS denominator or a unique overall WFE.
A diagnostic needs its research record
There is no universal acceptance threshold for WFE. TradeStation documents 50% as a user-adjustable default criterion, alongside other tests, including profitability and drawdown. That is a platform rule, not a statistical theorem or evidence that 50% is suitable for every strategy. See its Test Results criteria.
Read the ratio beside net OOS return, maximum drawdown, exposure, trading costs, sample length and concentration of gains. A high ratio can coexist with unacceptable losses along the path, a tiny IS denominator or one dominant OOS episode. TradeStation's FAQ specifically discusses values above 100%, sufficient data and realistic commissions and slippage.
WFE also does not correct overfitting from repeatedly trying strategies or window schedules and retaining the best OOS result. Those results have then informed selection. Bailey and co-authors' analysis of backtest overfitting, especially its discussion of holdouts and multiple trials, explains why apparently separate evaluation periods do not erase research selection.
Backtest Evaluation develops the linked-return accounting, drawdown and research record needed to interpret this ratio. It has a public preview; the full lesson requires membership.
Sources
Robert Pardo, The Evaluation and Optimization of Trading Strategies, second edition, Wiley, 2008, Chapter 11, p. 260, “What Rate of Profit Should We Expect?”
TradeStation, Test Results — Criteria, 10.00 help: configurable defaults and separate evaluation criteria.
TradeStation, Frequently Asked Questions, 10.00 help: walk-forward sequence, costs, overlapping IS windows and interpretation of WFE above 100%.
David H. Bailey, Jonathan M. Borwein, Marcos López de Prado and Qiji Jim Zhu, The Probability of Backtest Overfitting, author-university manuscript revised November 2014, introduction and comparison with holdout methods.