Tobin’s average q is the market value of a firm’s operations divided by the current cost of replacing the installed capital used in those operations. A ratio above one means the operations carry a market premium over their estimated replacement cost. Below one, the market values them at less than that cost. Researchers use this comparison to study corporate investment. The value of adding capital enters that decision through a separate measure called marginal q. Tobin, A General Equilibrium Approach to Monetary Theory
Value the same assets on both sides
A fictional manufacturer has common equity worth 120 million USD, debt trading at a market value of 30 million USD and installed capital that would cost 100 million USD to replace at today’s prices. The manufacturer has no other financing claims or assets outside the operating business.
The ratio changes when the cost estimate changes, even if the share and debt prices stay put.
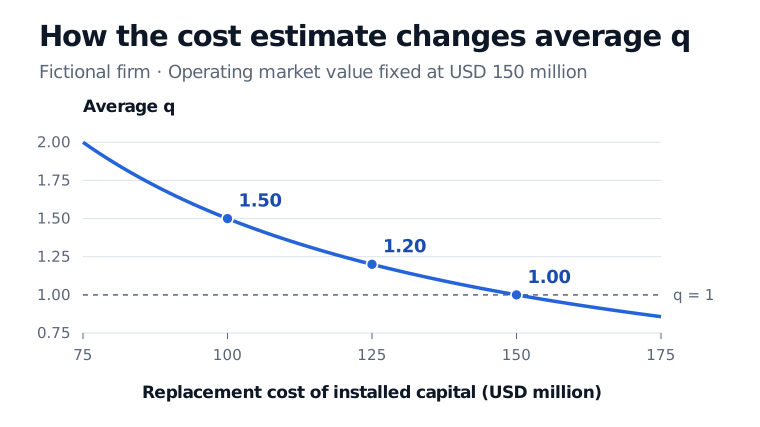
Revising the cost of replacing the installed capital from 100 to 125 million USD cuts the measured premium from 50% to 20% with market value held fixed.
In a real firm, market capitalisation covers common equity alone. Include other financing claims on the assets in scope. If the denominator excludes excess cash or separately held non-operating securities, deduct their value from the combined claims as in an enterprise-value bridge. Use the same valuation date on both sides.
The next unit of capital
Marginal q is the additional firm value from a small increase in installed capital per dollar of replacement cost for that increase. Suppose the manufacturer’s existing plants serve prime sites, but the next addition costs 10 million USD and adds just 8 million USD of value. This small-expansion estimate of marginal q is , alongside average q of . In a benchmark without taxes or extra installation costs, marginal q above one makes the next small addition worth more than it costs. With adjustment costs, the firm compares the added value with the full marginal cost of installing the capital. Hayashi, §§1–2
In Hayashi’s tax-free benchmark, a price-taking firm with constant returns to scale in both production and installation has equal average and marginal q. Scaling up installed capital scales firm value in the same proportion, so the next unit has the same value per replacement dollar as the existing stock. Market power can break that link because expanding output can lower the price the firm receives. Hayashi’s model also adjusts the relationship for tax deductions attributable to past investment. Hayashi, §3, Propositions 1–2
What the data can measure
Market prices are easier to obtain than current replacement costs for an entire productive asset base. Chung and Pruitt’s empirical approximation divides the sum of market common equity, preferred stock at liquidation value, and a debt proxy by book total assets. Their debt proxy adds book long-term debt to short-term liabilities net of short-term assets. Equity market-to-book instead divides market common equity by book common equity. These measures compare different claims and use different book values. Chung and Pruitt, equation 2 · Damodaran, Price to Book Ratio
Book costs can diverge from current replacement costs as equipment prices change. Internally developed productive assets can also be missing from the balance sheet. Holding market value fixed, leaving that capital out pushes the ratio up. Peters and Taylor estimate intangible capital by accumulating past spending such as R&D and allowing its contribution to depreciate. In a comparison across firms, the capital included and the estimation convention can move q alongside changes in market value. Peters and Taylor, §§3.1–3.2
Sources
- James Tobin (1969), A General Equilibrium Approach to Monetary Theory, especially §5.
- Fumio Hayashi (1982), Tobin’s Marginal q and Average q: A Neoclassical Interpretation, §§1–3.
- Kee H. Chung and Stephen W. Pruitt (1994), A Simple Approximation of Tobin’s q, §I.
- Ryan H. Peters and Lucian A. Taylor, Intangible Capital and the Investment-q Relation, §§3.1–3.2 in the author manuscript of the 2017 paper.
- Aswath Damodaran, Financial Measures and Ratios, price-to-book entry.