The Weekly Petroleum Status Report (WPSR) is the U.S. Energy Information Administration’s weekly release of U.S. crude oil and petroleum product inventories, supply and disposition. It gives energy analysts a way to separate the size of an inventory move from the flows that contributed to it. A crude draw can reflect heavier refinery runs, fewer imports or more exports, among other changes. EIA’s Weekly Petroleum Status Report
Follow the barrels through one week
Start a fictional week with 450 million barrels of crude. Domestic production adds 70 and imports add 35. Refineries take 90 and exports remove 28. The balance has a positive adjustment of 3. The opening and closing stocks are levels at the two week boundaries. Each flow and the adjustment are volumes in million barrels accumulated over that same week.
Stock change is closing minus opening, or million barrels. The negative change is a draw of 10 million barrels. A positive change would be a build. With the balance written as inflows minus outflows, the positive adjustment adds to closing stock in the calculation.
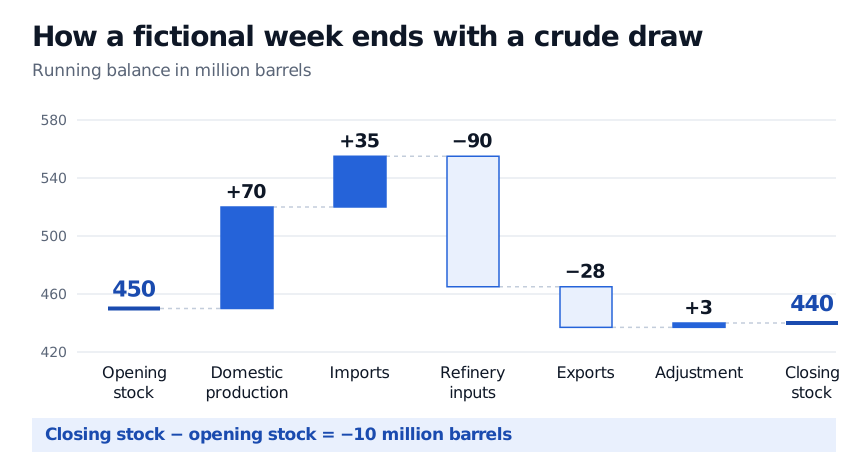
The steps apply the week’s flows in accounting order. Only the two endpoints represent stock levels at specific dates.
Find the matching rows in the release
Table 1 gives end-of-week inventory levels in million barrels. Its supply section uses average daily rates in thousand barrels per day. To compare the weekly stock change implied by a rate with the reported inventory change, multiply by seven and divide by 1,000 to get million barrels. Use the published difference where available. EIA calculates differences from unrounded data. EIA Table 1, 4 November 2026 release
Table 4 separates commercial crude stocks from the Strategic Petroleum Reserve (SPR). Its national crude row includes both. It also breaks commercial crude out by district, shows Cushing separately within the Midwest, and lists U.S. stocks of products such as motor gasoline and distillate. The bottom rows labelled total stocks cover crude and products together. EIA Table 4, 4 November 2026 release
The published national crude balance adds domestic production, transfers to crude oil supply, net crude imports and the signed adjustment, then subtracts refinery inputs. Net imports already deduct exports. Transfers include volumes such as natural gasoline and unfinished oils reclassified into crude supply. Table 1’s footnote 9 means EIA accounts for the transfer row when calculating the residual adjustment. In the published balance, use both line 4 (transfers) and line 16 (adjustment) once. The residual reconciles separately estimated quantities, which can differ because of reporting timing and estimation error. Identifying the source of the discrepancy requires evidence outside the balance. EIA Table 1, lines 1, 4, 7 and 13–17 · EIA Explanatory Notes
For the week ending 30 October 2026, the 4 November 2026 release gives the following reconciliation, in thousand barrels per day, in that same row order.
Over seven days that is a draw of about 1.3 million barrels, consistent with Table 4’s total crude row. The commercial draw was about 0.9 million barrels. The two changes describe different sets of stocks. EIA Table 1 · EIA Table 4
Keep the release date with the number
For a study of oil futures around the announcement, timestamp the observation by the actual release, which can shift on holidays. Use the archived issue available at that time and keep later corrections separate to avoid look-ahead bias. EIA publishes weekly revisions when it judges that they materially change the picture of U.S. petroleum supply. Compare the reported change with a pre-release expectation for the same inventory series and sign convention to measure the surprise. A draw can be a positive inventory surprise if the market expected a larger draw. Measure the price response separately. EIA release schedule · EIA Explanatory Notes, Revision Policy