Distinguish a process spectral density from its sample periodogram, convert FFT power into density and bin power, and understand leakage and estimator noise.
Periodogram and spectral density
A spectral density allocates a stationary time series' variance across frequencies. A periodogram estimates that frequency distribution from a finite sample by squaring and scaling its Fourier coefficients. For a quant studying returns, order flow or a model's residuals, this can reveal whether variation concentrates at slow or fast timescales. A tall peak alone does not establish a stable trading cycle.
The distinction is between a property of the stochastic process and a noisy statistic computed from observations. It is also a distinction between density and power: a density height must be multiplied by a frequency width before it becomes a contribution to variance.
The process has a spectrum; the sample has a periodogram
Let xt be a real-valued, weakly stationary process with mean μ and autocovariance γ(h)=Cov(xt,xt+h). Suppose ∑h∣γ(h)∣<∞. With frequency ν in cycles per sample, its two-sided spectral density is
This is the Fourier transform of the covariance sequence, not the probability density of a return. Its area is variance, not one. Larger low-frequency density means more variance associated with slow variation. Bartlett's spectral-density notes give this transform and inverse relationship. The summability assumption is sufficient for this ordinary density representation; stationary processes with spectral lines require a more general spectral measure.
If samples arrive at rate fs per time unit, physical frequency is f=fsν and density rescales as Sf(f)=S(f/fs)/fs. Integration over [−fs/2,fs/2] still gives the same variance. Cycles per day, cycles per observation and radians per observation are different conventions.
Follow the units through the FFT
For N equally spaced observations, let yt=xt−xˉ when removing the sample mean is appropriate. Use the unnormalised discrete Fourier transform:
An FFT is an efficient algorithm for this DFT; it does not choose the statistical interpretation or scaling. The bins above the positive Nyquist limit represent negative frequencies: for even N, k>N/2 maps to (k−N)fs/N.
For real observations, positive and negative interior frequencies carry equal power. A one-sided density keeps 0≤f≤fs/2 and doubles the interior positive ordinates. Do not double DC (k=0) or, for even N, the Nyquist bin (k=N/2). For odd N there is no Nyquist bin, so every retained positive bin is doubled. Complex-valued data generally need the two-sided representation. SciPy's periodogram reference documents its one-sided folding and scaling choices.
The density units are amplitude squared per unit of frequency. With this rectangular window and no zero-padding,
k∑I2(fk)Δf=k≥0∑I1(fk)Δf=N1t=0∑N−1yt2.
This is the finite-sample Parseval audit. After demeaning, the right side is the sample variance with denominator N, not the unbiased N−1 estimator. Without demeaning, it is the raw mean square and includes the mean's DC contribution.
Eight constructed observations
Take the dimensionless deterministic signal
xt=cos(2π⋅2t/8),t=0,…,7,fs=1.
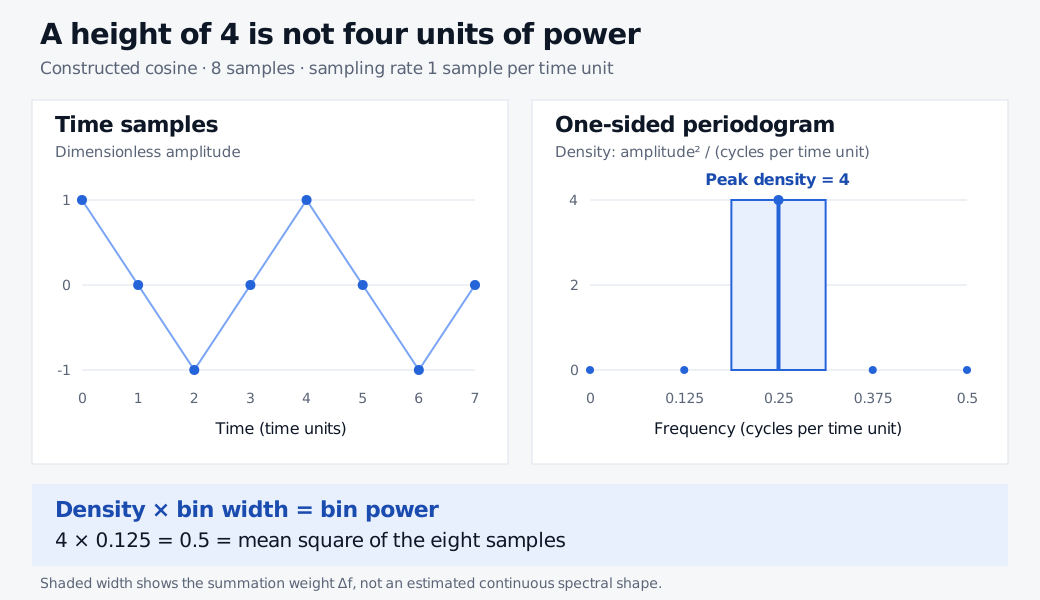
Its values, ignoring numerical rounding, are 1,0,−1,0,1,0,−1,0. The mean is zero. It completes two cycles in the eight-sample record, with period four time units. Only k=2 and k=6 have nonzero DFT magnitudes: both equal four.
Quantity
Calculation
Result
Raw squared coefficient at k=2
∣X2∣2
16
Two-sided density at f=0.25
16/(1⋅8)
2
Matching negative-frequency density
I2(−0.25)
2
One-sided density at f=0.25
2+2
4
Frequency bin width
1/8
0.125
One-sided bin power
4⋅0.125
0.5
Sample mean square
(1+1+1+1)/8
0.5
Constructed eight-point cosine has mean square 0.5. Its one-sided periodogram has density 4 at 0.25 cycles per time unit; multiplying by bin width 0.125 gives power 0.5.
Original deterministic illustration. The shaded width represents the frequency summation weight, not a continuous population spectral curve.
If the same eight values are instead sampled at fs=2, the positive peak moves to 0.5 cycles per time unit, its density becomes 2, and bin width becomes 0.25. Power remains 2⋅0.25=0.5. Neither the value four nor the eight observations prove a stochastic market cycle; this example isolates the bookkeeping.
INTERACTIVE EXPLORER
Finite Fourier spectrum
Sample two sinusoids and inspect aliasing, leakage and bin power.
Two reasons a real curve is harder to read
Finite observation spreads power. A sinusoid between Fourier bins leaks into nearby bins. A taper such as Hann reduces distant sidelobes while broadening the main lobe, making nearby components harder to separate. Zero-padding evaluates a denser frequency grid; it supplies no additional observations. The SciPy spectral-analysis guide illustrates these effects.
A density-scaled tapered periodogram uses
Iw,2(fk)=fs∑twt2∑twtyte−2πikt/N2.
Its integrated ordinate sum equals ∑twt2yt2/∑twt2, which need not equal the unweighted mean square. Amplitude calibration uses a different normalisation. Record the actual taper and mean/trend treatment; changing either changes the object being measured.
More data do not make each raw ordinate settle down. Under standard short-memory conditions, the unsmoothed periodogram is not a consistent estimator of the spectral density at an interior frequency with positive density. In the Gaussian white-noise case, at a nonzero, non-Nyquist Fourier bin with fs=1,
σ22I2∼χ22,E[I2]=σ2,Var(I2)=σ4.
That variance does not shrink as N grows. Bartlett's periodogram lecture develops the exact white-noise result and the asymptotic argument. Smoothing nearby frequencies can trade detail for stability. Welch's method averages tapered segment periodograms; shorter segments sacrifice frequency resolution, and overlapping segments do not supply independent replications.
Before calling a peak economic evidence
Justify the sampled clock and transformation. Irregular trades cannot simply be treated as equally spaced calendar-time data. Variation above the Nyquist frequency can alias into lower frequencies. Changing regimes, a trend or deterministic intraday seasonality can dominate the picture. Mean removal alone does not establish stationarity; the Stationarity and Unit Roots lesson distinguishes stationary fluctuations from unit-root levels and deterministic trends. Its public page is a preview; the full lesson requires membership.
Report the sample interval, units, detrending, taper, FFT length, side convention and smoothing rule. Then assess uncertainty, frequency-search effects and stability on new data before interpreting a peak as a repeatable mechanism. For comparing frequency-specific relationships between two series, cross-spectrum and coherence add joint phase and association; two auto-periodogram peaks alone do not show a shared stable relationship.