Patent and R&D signals turn invention disclosures and research spending into dated research features. Learn family deduplication, publication clocks and the limits of spending-normalised counts.
Patent and R&D signal
A patent and R&D signal is a research feature constructed from patent disclosures, research-and-development spending, or a combination of the two. It describes an aspect of a firm's inventive activity or research investment that a quant can compare across companies or through time. It does not, by itself, establish innovation quality, commercial success or a predictable stock return.
Patent records can add technical detail to fundamental data: what technologies a firm is pursuing, who is named on the documents and how its disclosed portfolio changes. R&D expenditure describes resources devoted to research and development over a period. Combining them requires a counting rule, an accounting definition and a historical information cutoff before it produces a meaningful feature.
Four families can outrank eight—under one stated definition
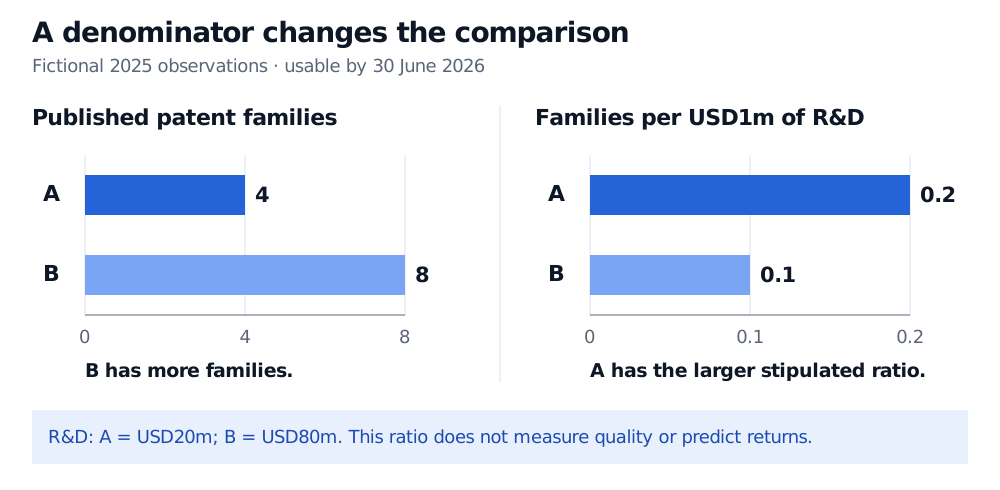
Consider two fictional companies. At a research cutoff of 30 June 2026, all inputs below have been published, received and processed. Count families whose first public patent disclosure occurred during calendar 2025. Use each company's already disclosed full-year 2025 R&D expenditure, with the same currency, comparable expenditure definitions and matching group boundaries.
Fictional company
Published patent families
Annual R&D, USD millions
Families per USD1m of R&D
A
4
20
0.2
B
8
80
0.1
For this example only, define the spending-normalised feature as
Si=RiFi,SA=204=0.2,SB=808=0.1,
where Fi is the eligible family count and Ri is annual R&D measured in USD millions. B has more disclosed families; A has the larger ratio after this stipulated normalisation.
Fictional firm A has four published patent families and USD20m annual R&D, giving 0.2 families per USD1m. Firm B has eight families and USD80m R&D, giving 0.1. B leads on count while A leads on this stipulated ratio.
Original fictional comparison: families first publicly disclosed during 2025 and comparable 2025 R&D, all usable by 30 June 2026. The two panels use different units; neither measures invention quality or expected returns.
Calling this ratio “innovation productivity” would overstate the evidence. The publications may reflect spending from earlier years, and current spending may support inventions disclosed much later. The numerator and denominator are paired by an analytical convention, not a demonstrated production relationship. A falling denominator can raise the ratio without any new patent disclosure. Zero R&D makes this ratio undefined; missing R&D is not zero.
Count families, then decide what the count represents
A patent family groups applications related through priority claims. A single invention pursued in several jurisdictions can generate several publication records. Counting each record as a separate invention can make geographic filing strategy look like additional inventive activity.
The EPO distinguishesDOCDB simple families, covering the same technical content, from INPADOC extended families, covering similar technical content. Different databases can produce different memberships. State the family definition, source vintage and treatment of related applications rather than assuming “one family” is a universal unit.
For the worked example, each eligible family contributes once to its assigned company, regardless of how many jurisdiction publications represent it. A real dataset also needs an explicit joint-owner allocation rule and a choice between newly disclosed families and the stock of existing patent rights. An application publication is not a grant; a cumulative document count is not a count of rights currently in force.
Patenting behaviour also differs by technology, legal system and firm strategy. Some inventions are kept secret; patented inventions differ greatly in economic value. The OECD's 2009 Patent Statistics Manual, §2.6, explains these limits. A comparison within a well-defined technology and reporting population is easier to interpret than an unexplained rank across unrelated industries.
A patent has several clocks
The earliest priority date helps locate an invention in the patenting process. It does not establish when an outside investor could read the application. Under the U.S. framework described in USPTO MPEP §1120, covered applications are generally published after eighteen months from the earliest filing date for which benefit is sought, with exceptions and provision for earlier publication. Do not convert that general timing into an assumed release timestamp for every record.
Information used
Historical eligibility question
Application text or technology classification
Had this version actually become public and reached the research process?
Grant outcome or granted claims
Was that outcome available by the decision, rather than learned later?
Forward citations received
Were the citing documents or reports disclosing those citations available by the cutoff?
Company ownership and family membership
Which mapping and database version could the process use then?
R&D disclosure or correction
Had this report or corrected version been released and processed?
Attaching later grants or lifetime citation totals to an earlier priority date creates look-ahead bias. Forward citations are references received from later documents; recent patents have had less time to accumulate them. The OECD manual's §6.5.1 discusses this age truncation and differences across fields and examination practices. Age or cohort adjustments require explicit assumptions; they cannot make future citations available in the past.
Assignee names also need historical care. A patent-owning subsidiary must be mapped to the investable company under a stated consolidation rule. Today's parent-company map can incorrectly attribute a later acquisition to an earlier portfolio. The USPTO assignment dataset includes records beyond transfers, such as name changes and security interests, so a recorded document is not automatically a purchase. MPEP §1121 also distinguishes assignee information printed on an application publication from separately recorded assignments.
Retain both the effective dates and the dates on which mappings, family corrections and disclosures became usable. Preserve frozen feature rows. The Point-in-Time Data lesson develops historical version selection and snapshot audits; its preview is public and the full lesson requires membership.
Spending this year is not the knowledge stock
Annual R&D expenditure is a flow over a period. A modelled R&D capital stock accumulates investment from several periods and allows for obsolescence or depreciation. Constructing that stock requires an initial value, a rule for eligible investment additions, a price basis and a depreciation assumption. It is neither the latest annual expense nor an observed market value of the firm's ideas.
Accounting adds a separate distinction. Under the IFRS Foundation's current IAS 38 summary, research expenditure is expensed, while development expenditure meeting specified criteria is recognised as an intangible asset. An expense-only field can therefore omit capitalised development. A reported intangible-asset balance, a statistical R&D expenditure measure and a researcher's estimated knowledge stock answer different questions. The Frascati Manual supplies the OECD framework for R&D statistics; a company accounting field should not silently be treated as that statistical measure.
For a trading study, freeze the feature definition before evaluation, preserve unsuccessful variants and test on later information. Any claim about returns needs its own economic hypothesis and backtest, including implementation costs. Neither more patents nor more R&D spending supplies that evidence on its own.
Sources
USPTO: MPEP §1120, current page checked 1 November 2026; section revision July 2022. Publication timing and exceptions.
OECD: Patent Statistics Manual (2009), §2.6, pp. 27–29; §6.5.1, pp. 111–113. Historical methodological guidance, not a claim that patent-office procedures are unchanged since 2009.