Mean absolute error and mean absolute percentage error
Compare MAE in target units with MAPE in percentages, distinguish WAPE, and see how small, zero and negative actuals change forecast scoring.
Mean absolute error and mean absolute percentage error
Mean absolute error (MAE) averages the magnitudes of prediction errors; mean absolute percentage error (MAPE) averages those magnitudes relative to each actual value. MAE answers “how far off, in the target's units?” MAPE answers “how far off, as a percentage of each realised target?” That denominator can make a small cash miss dominate a forecast report.
For n scored actuals yi and forecasts y^i, define the signed error here as ei=y^i−yi. Then
MAE=n1i=1∑n∣ei∣,MAPE=n100%i=1∑n∣yi∣∣ei∣,yi=0 for every scored case.
Taking absolute values prevents overestimates and underestimates from cancelling. Both scores are nonnegative, and zero means every scored prediction is exact, provided MAPE is defined. MAPE uses the actual, not the forecast, as its reference. It is an average of relative errors, not a percentage of an average actual.
Three days, two views of the misses
Consider a treasury model forecasting the next day's positive fee total. These are fictional observations, all measured in USD thousands, with forecasts issued before the corresponding day:
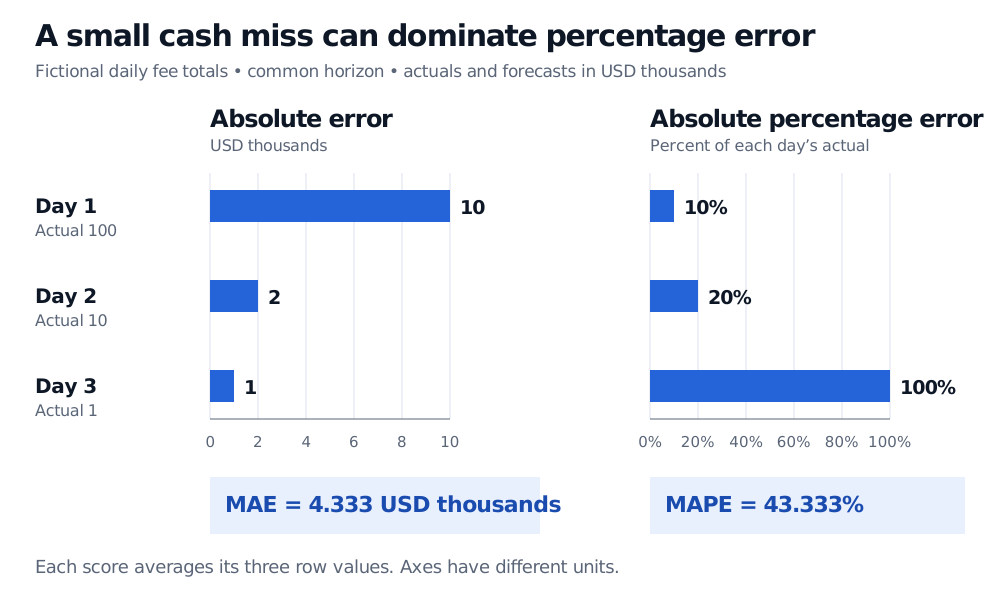
Fictional daily fee totals in USD thousands: actuals 100, 10 and 1, forecasts 90, 12 and 2. Absolute errors are 10, 2 and 1; absolute percentage errors are 10%, 20% and 100%. MAE is 4.333 USD thousands and MAPE is 43.333%.
Original fictional comparison. Each panel averages three row values; the two horizontal axes use different units. The smallest cash miss has the largest percentage error.
The third day contributes only 1 of the 13 thousand dollars of total absolute error, but 100 of the 130 percentage points being averaged for MAPE. Correcting just its forecast from 2 to 1 reduces MAE by one-third of a thousand dollars and MAPE by 33.333 percentage points. A percentage score changes which errors matter.
Changing the reporting unit from thousands of dollars to dollars multiplies MAE by 1,000 and leaves MAPE unchanged. A meaningful zero is still necessary: adding a constant to all actuals and forecasts leaves absolute errors unchanged but changes the percentages.
Dividing after summing gives WAPE
A tempting alternative is to divide total absolute error by total absolute actuals:
This is weighted absolute percentage error (WAPE), a different statistic. When every actual is nonzero, it weights each absolute percentage error by ∣yi∣/∑j∣yj∣. Ordinary MAPE gives each case equal weight after division, so the same absolute miss is penalised more at a smaller actual.
WAPE can include individual zero actuals if its aggregate denominator remains positive; it is undefined when all actuals are zero. It does not solve every comparison problem. A rising target level can lower WAPE through its denominator even when errors in the original units have not improved. Hyndman's discussion of WAPE develops that moving-scale problem.
When a percentage stops being useful
At a zero actual, unmodified MAPE is undefined, including when the forecast is also zero. Near zero, a modest error can produce an enormous percentage. This makes MAPE awkward for financial returns that repeatedly approach or cross zero: an actual return of 0.01% and forecast of 0.02% differ by just one basis point, yet the absolute percentage error is 100%.
For negative actuals, the magnitude denominator above keeps the contribution nonnegative. Simply dividing an absolute error by the signed actual would be wrong. Even with correct arithmetic, ask whether a “percentage of realised loss” or a percentage of a signed spread is a useful decision measure. Algebraic definability does not establish economic meaning.
Dropping zero observations changes the sample; inserting a small denominator floor changes the metric. State either convention and its coverage explicitly. Software can also differ from the formula: scikit-learn's MAPE documentation reports a fraction rather than multiplying by 100, and uses an epsilon denominator at zero, producing a large finite value. That output is not evidence that the unmodified percentage is mathematically defined.
Choose the score before comparing models
MAE is useful when a miss has a roughly linear cost in the target's units. It still grows with large errors; it is less sensitive to extreme misses than root mean squared error, not immune to them. Absolute-error loss targets a conditional median when its conditional expectation is finite. A mean forecast need not be optimal under that loss function.
MAPE may help when targets have meaningful, strictly positive levels and proportional discrepancies are the question. Its inverse-actual weighting is part of the objective, not a neutral unit conversion. Neither score retains error direction or describes the whole error distribution.
Compare models on the same target, horizon, units and later observations, using information available at each forecast origin. Forecast Evaluation develops rolling and expanding tests and comparisons under stated losses; the preview is public and the full lesson requires membership. If forecasts drive trades, assess the resulting positions, execution and costs separately. A lower forecast-error score alone does not determine strategy profit.
Rob J Hyndman, “WAPE: Weighted Absolute Percentage Error”, 8 August 2025, including “Update on consistency and stationarity”: aggregate denominator, weighting and changing target scale.
scikit-learn, mean_absolute_error and mean_absolute_percentage_error, checked 30 October 2026: nonnegative losses, aggregation options and MAPE's fractional reporting and zero-denominator convention.