IPO underpricing is the positive difference between an initial public offering’s offer price and its first aftermarket price, usually measured using the first trading day’s closing price. The usual initial-return statistic is the percentage change from offer to close. For a quant, the decisive distinction is access: an offer-price allocation and an exchange purchase after trading begins have different entry prices. A backtest that gives an aftermarket buyer the offer price can manufacture a return that buyer could never earn.
Let denote the final offer price and the first-day closing price. The conventional measure is
A positive value records underpricing relative to that market mark; zero records a flat debut and a negative value records overpricing on the same convention. It does not establish a gap from intrinsic value. Ritter and Welch (2002), Section II distinguish this initial return from subsequent IPO performance.
Follow the entry price
Consider a fictional company that sells shares at USD 20, opens in the secondary market at USD 24, and closes its first day at USD 25. Ignore fees, taxes and distributions.
| Entry and endpoint | Gross mark-to-market return | What the number describes |
|---|---|---|
| Offer at 20 → first close at 25 | 25.00% | Initial return for shares allocated at the offer |
| Offer at 20 → first open at 24 | 20.00% | Opening gap on the offer-price base |
| First open at 24 → first close at 25 | 4.17% | Return for a buyer who actually obtains an opening fill at 24 |
The opening gap and the open-to-close return compound: . Adding the two percentages would mix different capital bases.
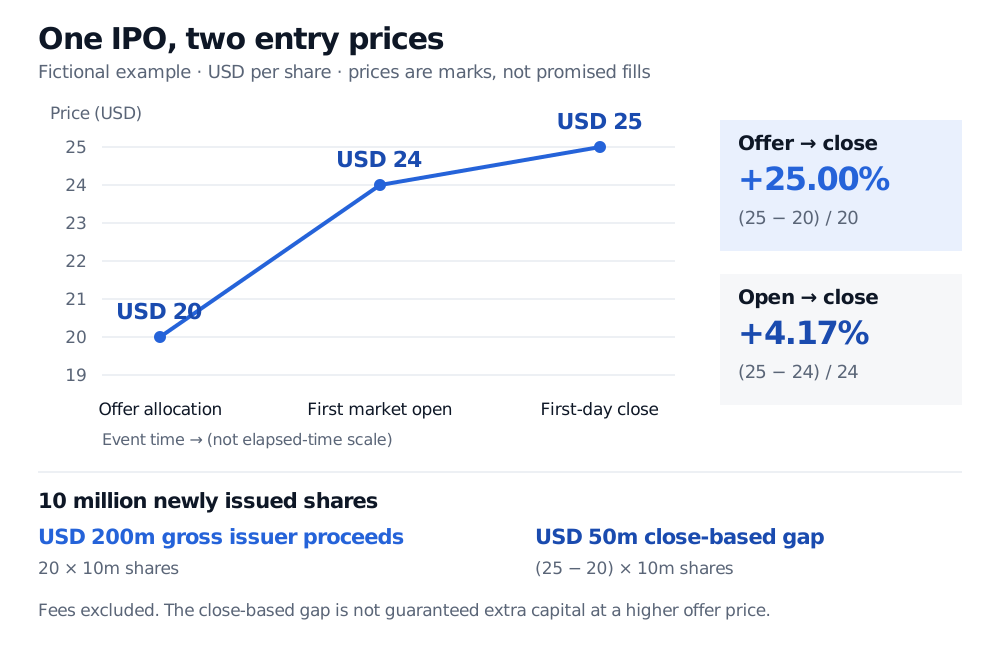
Original fictional example. Prices are marks; buying or selling the required quantity at the open or close is not guaranteed. Fees are excluded, and the price axis starts at USD 19.
The 25% is a paper gain until the allocated investor sells. Neither a first trade nor a closing mark proves that an entire allocation could be liquidated at that price. Available depth, execution timing, transaction costs, allocation terms and any applicable sale restrictions affect realised proceeds. A pre-IPO holder subject to an IPO lockup is also a different investor from a buyer receiving an unrestricted offer allocation.
An IPO can go the other way: keeping the offer at USD 20 but changing the first close to USD 18 gives an initial return of −10%. The SEC’s IPO investor bulletin, updated October 2022, explains that offering and subsequent trading prices can differ in either direction.
Which money was left on whose table?
Suppose the original example consists of 10 million newly issued shares, with no selling-shareholder tranche or overallotment. The company raises gross proceeds of
The primary-share component of “money left on the table” is
This compares offer proceeds with the same shares marked at the first close. Net issuer proceeds are lower than USD 200 million after underwriting discounts and other issuance expenses. The USD 50 million is neither an invoice nor an automatically recoverable loss. Raising the offer to USD 25 could change participation, allocation, the quantity sold and the subsequent market price. The observed close does not identify that counterfactual equilibrium or prove a USD 50 million social welfare loss.
Do not multiply the USD 5 gap by every share outstanding. Retained shares were not sold in this offering. Conversely, some IPOs include existing owners selling shares alongside the company’s new shares. If this example additionally included 2 million secondary shares sold at USD 20, those holders would receive USD 40 million gross. Their close-based gap would be USD 10 million; the combined offered-share gap would be USD 60 million, of which USD 50 million concerns the primary tranche. The company would still raise USD 200 million gross. The SEC bulletin’s “Selling shareholders” section explains this proceeds distinction.
Loughran and Ritter’s original 2004 study measures money left on the table using offered shares and explicitly excludes overallotment options in Table I. Its historical sample conventions should be checked before comparing an empirical series with a differently defined deal total.
Why a discount can survive competition
The offer price emerges from negotiation and demand gathering before open exchange trading. Several mechanisms can separate that price from the first market mark:
- Allocation selection. In an information-based explanation, informed investors compete hardest for attractive issues. Less-informed applicants receive smaller allocations of those issues and fuller allocations of unattractive ones. A discount can help compensate them for this winner’s curse.
- Information incentives. In bookbuilding models, underwriters can reward investors for revealing useful demand information through price and allocation decisions.
- Conflicting objectives. Underwriters, issuing managers and other shareholders need not value proceeds and investor relationships identically. Loughran and Ritter examine historical agency explanations for changes in underpricing, rather than treating it as a fixed payment for risk.
These are explanations to investigate, not diagnoses obtained from a single price jump. Ritter and Welch review competing mechanisms; no one mechanism follows from the initial-return formula.
A small allocation example shows why a positive average is insufficient. Imagine two equally likely offers at USD 10. One closes at USD 12; the other at USD 9. Their unweighted mean initial return is 5%. An investor requests 100 shares in each but receives only 10 in the good issue and all 100 in the bad issue. Across one occurrence of each, the marked gain is dollars on USD 1,100 invested: −7.27%. This fictional two-issue ledger excludes unallocated cash and all costs. It isolates allocation selection; it is not an empirical estimate or a universal allocation rule. The SEC’s allocation explainer describes why access to popular offerings can be limited.
Measuring an issuance effect without inventing a strategy
An IPO dataset needs the final offer price, trading-start date, chosen first aftermarket mark, offered share counts and allocation assumptions. Define whether the sample includes operating companies, funds, very small offerings and withdrawn deals; those choices change the population. Retain unsuccessful outcomes to avoid survivorship bias. Keep a research observation of offer-to-close underpricing separate from a feasible portfolio simulation with actual entry prices and obtainable quantities.
First-day underpricing also says nothing mechanically about returns over the next year. That is a separate horizon requiring its own start price, benchmark and treatment of distributions and delistings. For a broader use of issuance data, Behavioral Asset Pricing Models discusses IPO first-day returns among aggregate sentiment indicators in its investor-sentiment section. The preview is public; the full lesson requires membership. An aggregate indicator does not promise a profitable trade in the next IPO.
Sources
- Ritter and Welch (2002), A Review of IPO Activity, Pricing, and Allocations, Table I and Section II: measurement, allocations and alternative explanations; Section III treats later performance separately.
- Loughran and Ritter (2004), Why Has IPO Underpricing Changed Over Time?, introduction, Sections I–III and Table I: historical research, issuer incentives and offered-share conventions.
- SEC Office of Investor Education and Advocacy, Updated Investor Bulletin: Investing in an IPO (14 October 2022), “How do I invest in an IPO?”, “Offering price” and “Selling shareholders.”
- Investor.gov, Initial Public Offerings, Why Individuals Have Difficulty Getting Shares, underwriting and popular-offering allocations.