Cost synergies are recurring expense savings made possible by combining two businesses. Revenue synergies are additional sales made possible by the combination, such as selling one company's product to the other's customers. Estimate both against what the two businesses would have done separately. Then convert the sales uplift into operating contribution and work out when each benefit starts.
Build the estimate against a standalone baseline
- Cost savings. Start with an expense the deal lets you remove, such as duplicate software licences. Subtract any recurring replacement costs and exclude cuts already in either company's standalone plan. Schedule the saving when the old contract ends, and budget any termination fee or migration expense separately.
- Revenue contribution. Estimate eligible customers, uptake, timing and net price for each initiative. Deduct the incremental costs of winning and serving those sales, such as commissions and fulfilment. If the new offer cannibalises an existing product sale, subtract the contribution lost on that sale too. Use the margin on the incremental sales and the margin on the displaced sales separately when their economics differ.
A supplier contract can give a cost estimate a firm starting point. A cross-sell forecast may still depend on untested customer behaviour. A delay changes when the benefit arrives. Weaker uptake can cut the benefit even after rollout. In its October 2026 shareholder letter, Coursera described a USD 115 million annual run-rate net synergy target for the Udemy deal that allowed for about USD 35 million in potential lost gross profit. It discussed one-time cash expenses separately. Coursera, Q3 2026 shareholder letter
From annual run-rate to the first year
Suppose a fictional merger produces USD 20 million a year in net recurring cost savings and USD 30 million a year of incremental sales at a 30% incremental contribution margin. Assume all of those sales are net new. The extra sales contribute USD 9 million after incremental costs, bringing the annual pre-tax operating run-rate to USD 29 million once both initiatives are fully in place.
Let be annual net cost savings, annual incremental sales, the contribution margin and the integration expense incurred in the first 12 months after closing. In this pre-tax bridge, with a constant incremental margin, and are the fractions of each annual benefit delivered during those 12 months.
With USD 10 million of one-time integration expense and a full year of both benefits, the first-year net contribution is USD 19 million. If both benefits begin halfway through the year at their full pace, they contribute USD 10 million and USD 4.5 million in Year 1. The same integration expense leaves USD 4.5 million. If sales start later and contribute only one-third of their annual amount, the first-year net falls to USD 3 million. The annual run-rate stays at USD 29 million in all three cases.
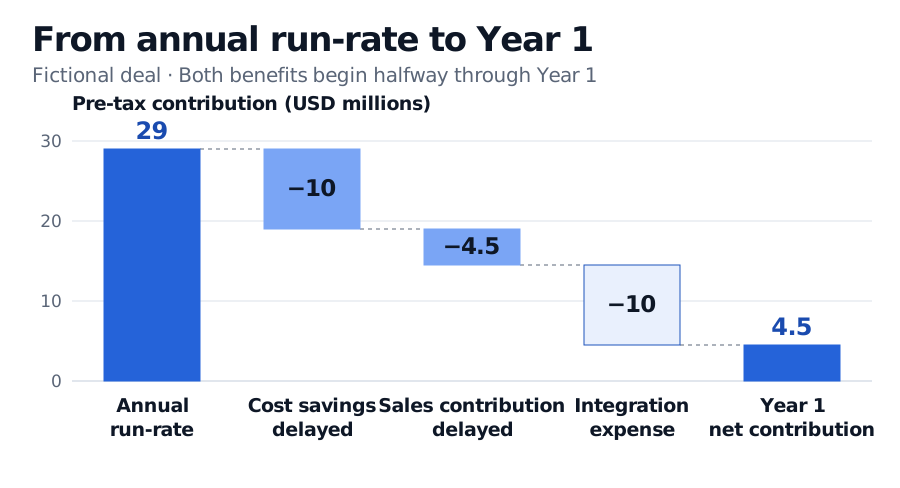
Both benefits start halfway through Year 1. The first two deductions are the benefits forgone during the first six months. The final deduction is the one-time expense.
Where the forecast goes next
For accretion/dilution analysis, the phased operating benefits feed a same-period earnings forecast alongside taxes, financing costs and purchase accounting. The forecast also needs the weighted share count. For discounted cash-flow valuation, model the incremental cash flows by period. Account for cash taxes, working capital, capital spending and when integration bills are actually paid. Count each payment once and use the timing and risk of the cash flows to estimate their present value. Aswath Damodaran, The Value of Synergy
Sources
- Coursera, Q3 2026 shareholder letter, “Synergies progress” and “Modeling considerations”.
- Aswath Damodaran, The Value of Synergy, “Operating Synergy” and “Steps in Valuing Operating Synergy”.