A reported emissions quantity, a provider's rating and a predicted stock return are different objects. Calling all three “ESG” does not make their units, purposes or economic meanings interchangeable.
Which question does the number answer?
| Object | Example | What must be specified |
|---|---|---|
| Underlying metric | Annual tonnes of greenhouse-gas emissions | Reporting boundary, period, units and whether measured or estimated |
| Rating or composite score | A weighted assessment of selected ESG issues | Provider, issue definitions, weights, scale direction and peer group |
| Investment feature | Within-industry rank, controversy indicator or score change | Transformation, data availability and intended use |
| Return forecast | Expected return associated with that feature | Holding horizon, reference model and evidence beyond the score itself |
A ranking can reverse without either company changing
Take two fictional companies with scores on an environmental criterion and a social criterion . Higher scores are better on both criteria by construction. Governance is omitted solely to keep the example transparent; this is not a replica of a commercial ESG methodology.
| Company | Environmental criterion | Social criterion |
|---|---|---|
| A | 80 | 20 |
| B | 20 | 80 |
Assume the two score scales are suitable for a weighted sum. If is the environmental weight, define the composite
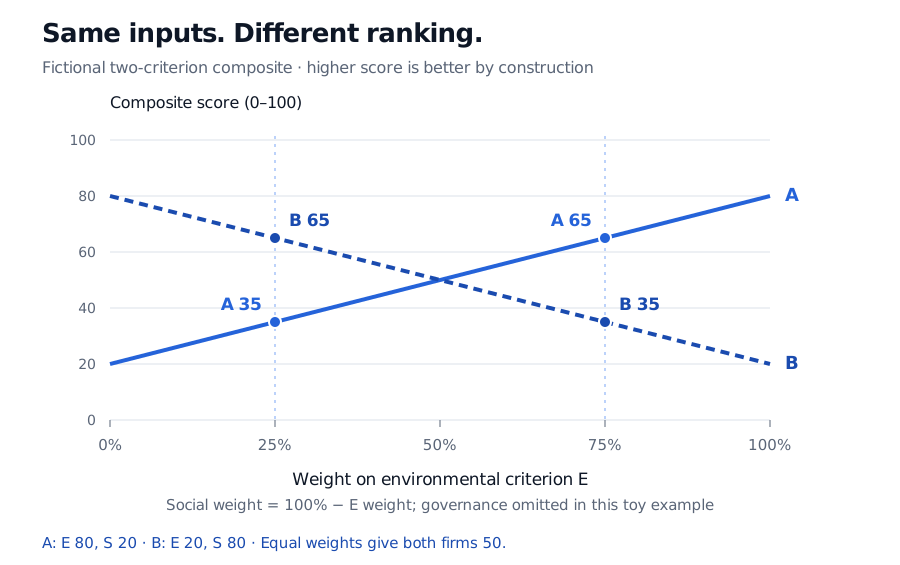
Even one environmental metric needs a denominator
In a separate fictional emissions example, suppose both companies use the same emissions boundary and annual reporting period, with revenue measured in the same currency and price basis.
| Company | Emissions, tonnes CO₂e | Revenue, millions | Emissions intensity, tonnes CO₂e per million revenue |
|---|---|---|---|
| A | 50 | 10 | 5 |
| B | 80 | 40 | 2 |
An industry-relative signal poses another question again: how does a company compare with its peers? Within-industry ranking or sector controls can reduce a strategy's incidental industry exposure, but they can also remove between-industry variation relevant to an absolute-emissions objective. Choose the transformation to match the mandate and state what it removes.
Turn the feature into a testable investment claim
A return study needs a mechanism and a horizon: is the feature intended to capture an unpriced cash-flow risk, a future change in demand, or something else? Better risk management does not logically imply a higher expected excess return at today's price. A constraint that expresses an investor's preferences can be useful even when no return-predictive claim is made.
For an ESG return hypothesis, the important research choices are concrete:
- Keep the feature observable at the decision time. Store the reporting period, public release date, vendor availability date and data version. A fiscal-year label is not proof that the score was tradable at that year-end. Later estimates and restatements belong to later information sets.
- Separate changes in the company from changes in the measuring system. New controversy information, a revised methodology and a backfilled observation can all move a score. They have different interpretations.
- Treat missingness as information about coverage. Do not silently turn an unrated company into the lowest-rated company. State exclusion or imputation rules and examine whether coverage depends on size, geography or disclosure.
- Identify competing exposures. Compare results with and without relevant industry, size and other risk controls. Test a frozen specification on later data, include turnover and costs, and report sensitivity to provider and construction choices. A successful backtest of one specification does not establish a universal ESG premium.
Sources
- MSCI, ESG Ratings: “What do MSCI ESG Ratings measure?” and “How investors use MSCI ESG Ratings”. Official description of this provider's rating objective and industry-relative comparison.
- MIT Sloan Sustainability Initiative, Aggregate Confusion Project: research summary of Berg, Kölbel and Rigobon (2022). Authors' institutional account of scope, measurement and weight disagreement; the published paper is Review of Finance, 26(6), 1315–1344.
- Berg, Fabisik and Sautner, Is History Repeating Itself? The (Un)predictable Past of ESG Ratings, August 2021, §§2.2.1–2.2.4. Original working paper documenting historical data revisions and their implications.