Evaluate an entire predictive distribution with CRPS, calculate an exact ensemble example, and distinguish empirical-distribution scores from fair ensemble estimators.
Continuous ranked probability score
The continuous ranked probability score (CRPS) measures the error of a predictive distribution for a real-valued outcome. It scores the full distribution rather than only its mean: two return forecasts with the same expected return can receive different scores. Lower is better, using the nonnegative loss convention throughout this article.
At each threshold z, the forecast says how likely the outcome is to be at or below that threshold. The observation supplies a zero-or-one answer. CRPS integrates these binary Brier-score errors across thresholds. A discrete forecast is allowed despite the word continuous in the name. See Gneiting and Raftery, §4.2; their main definition uses a reward sign, and they also give the loss convention used here.
Three scenarios, one realised outcome
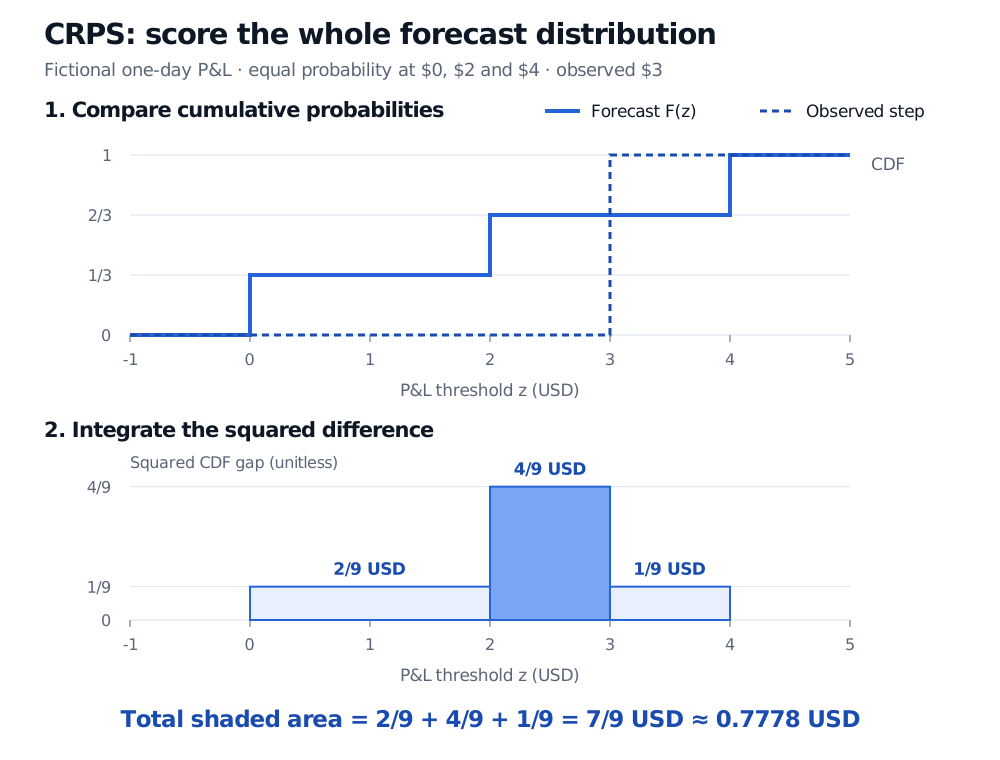
Suppose a fictional one-day P&L forecast assigns probability 1/3 to each of 0, 2 and 4 USD. The realised P&L is 3 USD. This is the empirical distribution of three equally weighted scenario values; these are stipulated forecasts, not historical market observations.
The forecast CDF is 1/3 between 0 and 2, 2/3 between 2 and 4, and 1 thereafter. The observed step jumps from 0 to 1 at 3. The integral therefore has only three nonzero pieces:
For a fictional P&L forecast with equal mass at 0, 2 and 4 USD and observation 3 USD, squared CDF gaps contribute 2/9, 4/9 and 1/9 USD. Their sum is CRPS 7/9 USD.
Original fictional forecast. The lower panel squares the vertical gaps in the upper panel; rectangle width is measured in USD, so the total area is also in USD.
The squared gaps are dimensionless, but integration is over P&L thresholds in USD. Hence CRPS has the same units as the response, not squared USD. Changing the input units to cents multiplies this score by 100; scores must use a consistent target, horizon and unit.
There is a second way to obtain the same answer. For independent draws X,X′ from F with finite first absolute moment,
CRPS(F,y)=E[∣X−y∣]−21E[∣X−X′∣].
For this forecast the mean distance to 3 is (3+1+1)/3=5/3. The nine ordered scenario pairs have total distance 16, so half their average distance is 16/(2×9)=8/9. Subtracting gives 5/3−8/9=7/9 again. The two draws are independent from the same forecast distribution; they are not successive market returns.
A point forecast is a distribution concentrated at one value. Putting all mass at 2 USD makes the pair-distance term zero and gives CRPS ∣2−3∣=1 USD. The scenario forecast beats that point forecast on this observation. A forecast concentrated at the realised 3 would score zero, but choosing it after seeing the outcome is not forecasting.
The denominator changes the question
For an issued empirical forecast with m equally weighted members, the exact pair formula is
The m2 ordered pairs include the diagonal pairsi=j, whose distances are zero. This is the empirical or V-statistic form. Dropping those zeros while still dividing by m2 is harmless; replacing the denominator changes the score.
If the members are instead independent draws from an underlying forecast law, independent of the verifying outcome conditional on the forecast information, a fair estimator of that law's CRPS uses m(m−1) in place of m2, for m>1. Its pair term is a U-statistic over distinct members. For the same three values it gives 5/3−16/12=1/3 USD. That is not the CDF area of our issued three-point distribution. The distinction is the evaluation target, not a numerical correction to 7/9. The unbiased interpretation requires the sampling assumptions; dependent ensemble members do not automatically qualify. See Ferro's fair-score analysis and the scoringrules ensemble formulas.
What a lower score establishes
CRPS is strictly proper on distributions with finite first absolute moment: in expectation under the true distribution, reporting that distribution uniquely minimises the score. In conditional forecasting, apply this statement to the outcome law given the information available at the forecast origin. It is an expected-loss property, not a guarantee that a fitted model or one favourable test score is calibrated.
For out-of-sample evaluation, record each distribution before its outcome arrives, then compare average CRPS on common dates against a stated benchmark. Serially dependent losses and overlapping horizons affect uncertainty in the comparison. The SelfMadeQuant lesson Forecast Evaluation develops timing, common-date comparisons and dependence caveats (public preview; full lesson requires membership).
CRPS aggregates errors across thresholds. A lower average score does not by itself establish reliable extreme-tail probabilities or interval coverage; examine the relevant thresholds and coverage separately. Nor does a distributional forecasting score include execution costs, position sizing or strategy profit.