Allocate aggregate bar volume using standardised price changes, reproduce a normal-CDF example, and distinguish estimated flow from aggressor truth and VPIN.
Bulk volume classification
Bulk volume classification (BVC) allocates an aggregate bar's traded volume between estimated buys and sells using a probability weight derived from its standardised price change. It lets a quant construct an estimated flow series from bar prices and volumes when individual aggressor flags are unavailable. It does not recover the identities or directions of individual executions.
Every execution has a buyer and seller. Here “buy volume” means an allocation intended to represent buyer-initiated flow, not volume with no seller. Unlike assigning a trade sign to each print, BVC produces a fractional split for the whole bar. Easley, López de Prado and O'Hara set out the approach in Discerning Information from Trade Data, §2.
One bar, two allocations
Let Vt be bar volume and Pt its final transaction price. Use the close-to-close change ΔPt=Pt−Pt−1, including the previous bar's close, rather than the current bar's open-to-close change. For a positive scale σΔP,t, define
zt=σΔP,tΔPt,Bt=VtF(zt),St=Vt[1−F(zt)].
F is the chosen cumulative distribution function. This choice matters: the authors' February 2015 manuscript uses a Student t CDF with a degrees-of-freedom parameter. The normal-CDF formulation described in Andersen and Bondarenko, §3.2, equation (4) uses F=Φ, the standard normal CDF. The example below explicitly uses that normal variant. A CDF weight is not automatically a calibrated posterior probability for actual trade direction.
The estimated signed volume follows directly:
Xt=Bt−St=Vt[2F(zt)−1].
The allocations sum to Vt; they do not create extra traded volume. For a symmetric CDF, zero price change gives a half-and-half allocation. That is the model's neutral output, not evidence that observed aggressor volumes were equal.
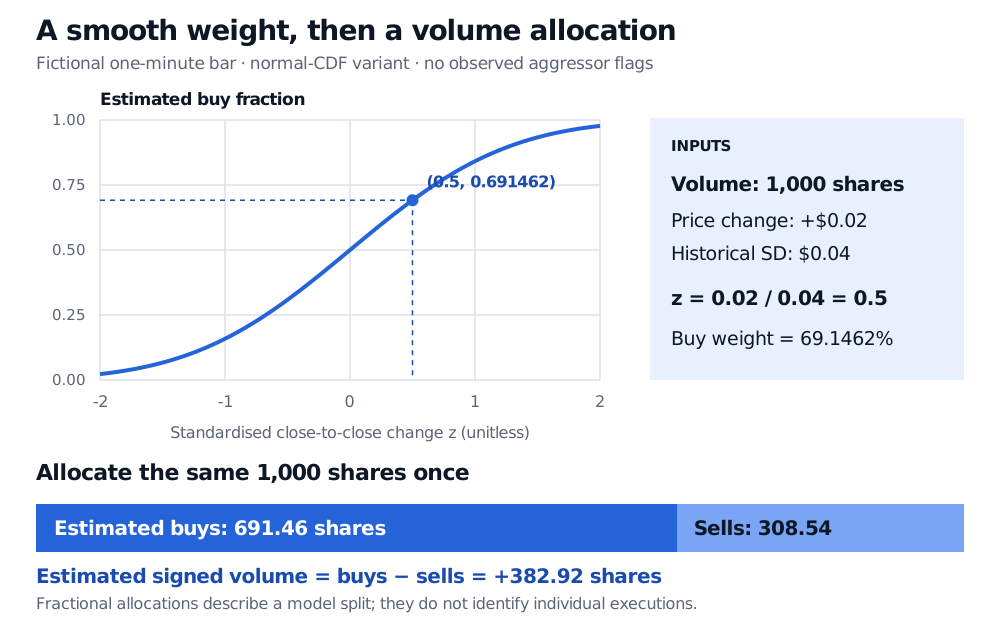
Suppose a fictional one-minute bar contains 1,000 shares. The preceding close is USD 100.00 and the current close is USD 100.02. Stipulate a historical standard deviation of one-minute close-to-close price changes of USD 0.04 per share, estimated using completed earlier bars and held fixed for this calculation. Thus
zt=0.02/0.04=0.5,Φ(0.5)=0.6914624613.
Model output
Shares, rounded
Estimated buys
691.46
Estimated sells
308.54
Estimated signed volume
+382.92
The fractional shares are expected allocations. They are not a claim that a particular execution can be split into an observed buyer-initiated fraction.
Fictional normal-CDF example: a standardised price change of 0.5 gives buy fraction 0.691462. A 1,000-share bar is allocated to estimated buys of 691.46 and sells of 308.54, giving signed volume of plus 382.92 shares.
Original fictional example: the CDF maps a standardised change to a weight, which partitions the bar's existing volume.
The construction is part of the measurement
For a reproducible series, record these choices alongside its values:
Bar definition: calendar duration or volume threshold, session boundaries, treatment of auctions and incomplete bars. If a trade crosses a volume threshold, specify splitting or overshoot. Classification bars and any later aggregation buckets need not coincide.
Price and scale units: this example divides a dollar price change by a dollar standard deviation at the same bar frequency. Dividing by annualised percentage volatility changes the meaning. Using returns instead requires a return-based scale and an explicit return convention.
Fitted parameters: specify the historical window, weighting, CDF family and any fitted shape parameters. Fit with information available by the decision time. A whole-sample volatility estimate silently gives earlier observations future information.
Invalid inputs: if scale is zero, missing or nonfinite, leave classification unavailable under a declared policy; do not silently replace it with an infinitesimal positive value. Missing closes are not zero changes. A zero-volume bar contributes no allocated shares, but does not supply a fresh transaction price.
Availability time: the completed bar's close, volume and computed weight become usable only after the required records arrive and processing finishes. Save that timestamp, especially when late reports can revise bars.
The scale is economically consequential even with unchanged price and volume. In the example, doubling the stipulated standard deviation to USD 0.08 reduces estimated buys to 598.71 shares. This is sensitivity to the chosen normalisation, not new evidence about the transactions.
Event Time and Alternative Bars develops bar construction, overshoot and feature availability. Order Flow and Adverse Selection builds signed-volume features and distinguishes execution flow from displayed book imbalance. Both previews are public; full lessons require membership.
What the price transformation cannot establish
Identical bar volume and close-to-close movement receive identical BVC outputs. Those two inputs cannot distinguish a bar with 600 buyer-initiated and 400 seller-initiated shares from one with 800 and 200 if both finish at the same price. Trade paths, quote changes and hidden liquidity can differ inside the bar.
Accuracy also depends on the target: matching aggregate buys and sells differs from labelling individual executions, and neither identifies private information. Andersen and Bondarenko, §§6.1–6.2 and 7.2.3 examine aggregation effects and the mechanical relationship between price-based classification and volatility. Chakrabarty, Pascual and Shkilko (2015) find that conventional trade classifiers outperform BVC in their equity sample. These findings caution against claiming universal superiority. Evaluate the chosen specification against documented aggressor flags when available; forecasting performance needs a separate test.
BVC is also not VPIN itself. VPIN additionally aggregates allocated flow into volume-clock buckets and averages absolute normalised bucket imbalances over a rolling window. Changing bucket construction or the averaging window changes that statistic even if the classifier is unchanged. A signed BVC allocation therefore cannot be relabelled a probability of informed trading. Andersen and Bondarenko, §§3.1–3.3.
Sources
Easley, D., López de Prado, M. and O'Hara, M. Discerning Information from Trade Data. February 2015 manuscript, §2, equation (1), §5 and Appendix A.2; subsequently published in Journal of Financial Economics (2016).