Bank financial statement analysis connects a bank’s loans and securities, the deposits and borrowings that fund them, and the income and risks those positions create. For a bank equity analyst, it helps explain whether earnings changed because the bank lent more, earned more on its assets, paid more for funding, or set aside more for credit losses.
Start with what earns interest and what costs interest
On the balance sheet, loans the bank has made are assets. Customer deposits are liabilities because the bank owes that money back. Interest on loans and securities and the cost of interest-bearing deposits and borrowings flow into the income statement. Noninterest-bearing deposits can fund earning assets without a direct interest expense, although that funding can still leave. To explain a change in margin, compare average balances, yields and funding rates by category. If deposit rates reset faster than fixed-rate loans, funding can get more expensive before loan yields catch up. PNC 2025 Form 10-K, Item 7, Tables 3 and 36–37
Suppose a fictional bank records USD 90 million in interest income and USD 40 million in interest expense over a full year. Its net interest income (NII) is USD 50 million. With USD 1,000 million in average earning assets, its net interest margin (NIM) is
That is USD 5 of net interest income per USD 100 of average earning assets for the year. Use the earning-asset average for the same reporting period. A year-end snapshot can miss changes during the year, and total assets include items outside the earning-asset base. For quarterly comparisons, check how the issuer annualises the ratio. Check the footnotes for how it measures the average balances too. For example, PNC includes nonaccrual loans in its average loan balance and measures its average securities balances at amortised historical cost. FDIC Quarterly Banking Profile, Q1 2026, glossary, PNC 2025 Form 10-K, Item 7, Table 36
Check the tax basis. Some banks report a taxable-equivalent margin, which grosses up eligible tax-exempt interest to the pretax amount a taxable investment would need to earn to deliver the same after-tax income. For 2025, PNC added USD 117 million to its USD 14,410 million of GAAP NII. The adjusted numerator over its disclosed USD 512,683 million of average earning assets gives the published 2.83% taxable-equivalent NIM. Using GAAP NII with the same denominator gives 2.81%. The FDIC profile uses unadjusted interest, so compare on a common basis. PNC 2025 Form 10-K, Item 7, Tables 3 and 38, FDIC Quarterly Banking Profile, Q1 2026, glossary
The same margin can leave less profit
Under accrual accounting, a bank can recognise interest on a performing loan before receiving cash. When a loan goes on nonaccrual, the bank stops accruing interest on it under its nonaccrual policy. Read that policy alongside the credit note. For loans held for investment under U.S. GAAP’s current expected credit losses framework, the allowance for credit losses is the amount set against the loans on the balance sheet for expected losses. The provision for credit losses adjusts that estimate through earnings, while charge-offs for amounts deemed uncollectible reduce the allowance. The allowance roll-forward shows how those movements fit together. PNC 2025 Form 10-K, Notes 1 and 3, U.S. interagency policy statement on allowances for credit losses, revised April 2023
In the fictional bank, add USD 10 million in fee income and subtract USD 25 million in operating costs. That leaves USD 35 million before provisions. Holding those lines and NII fixed, a provision of USD 8 million leaves USD 27 million before tax. A provision of USD 24 million leaves USD 11 million, with NIM still at 5%.
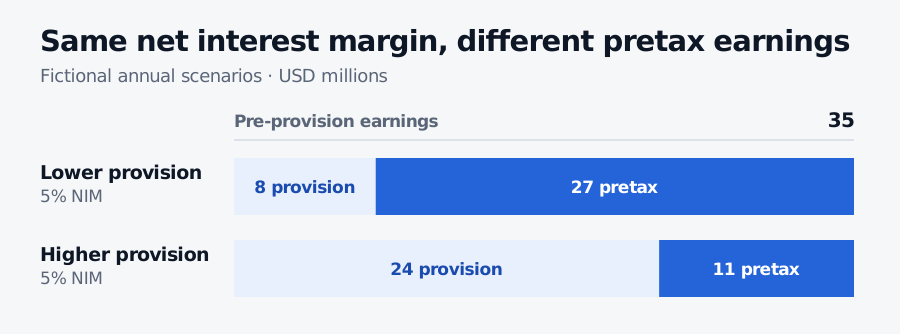
With net interest income, fees and operating costs held fixed, a larger provision reduces pretax profit dollar for dollar.
A positive provision can still come with a falling allowance. PNC began 2025 with a USD 4,486 million allowance for loan and lease losses. It added USD 660 million in provisions and USD 8 million in other changes, while net charge-offs reduced the allowance by USD 744 million. The year-end balance was USD 4,410 million. Use the loan-specific provision for that reconciliation. The consolidated provision also covers other exposures. PNC 2025 Form 10-K, Tables 6 and 55
Read capital and liquidity separately
Accounting earnings describe performance over a period. Regulatory capital measures the bank’s capacity to absorb losses against its exposures. Under the Basel risk-based framework, the Common Equity Tier 1 ratio divides eligible common equity capital after regulatory adjustments by risk-weighted assets. Retained profit can add to capital, and a change in the risk-weighted asset base can move the ratio independently of that profit. Use the bank’s regulatory capital reconciliation and check whether it covers the holding company or the bank subsidiary. Basel Framework, RBC20, PNC 2025 Form 10-K, Item 7, Liquidity and Capital Management
Liquidity concerns the bank’s ability to meet cash outflows when they come due. A bank can report positive interest income on long-dated loans while customers are withdrawing deposits today. Check funding concentrations, available liquidity and the terms on which assets can be sold or pledged. For banks subject to the liquidity coverage ratio, the ratio compares eligible high-quality liquid assets with projected net cash outflows over a 30-calendar-day stress scenario. Basel Framework, LCR20, PNC 2025 Form 10-K, Item 7, Liquidity and Capital Management
Sources
- The PNC Financial Services Group, Inc., Form 10-K for the year ended 31 December 2025
- FDIC, Quarterly Banking Profile, Q1 2026, glossary and reporting conventions
- U.S. interagency policy statement on allowances for credit losses, revised April 2023
- Basel Committee on Banking Supervision, Basel Framework, RBC20 risk-based capital requirements
- Basel Committee on Banking Supervision, Basel Framework, LCR20 liquidity coverage ratio calculation