Menchero linking reconciles arithmetic attribution across compounded periods using a common scale and minimum squared corrections, including equal-return limits.
Menchero optimised linking
Menchero optimised linking combines single-period arithmetic attribution effects into contributions that sum to the difference between compounded portfolio and benchmark returns. It uses a common scale plus the smallest squared period corrections needed for reconciliation. A performance report can therefore explain the whole horizon without leaving a compounding residual.
The inputs are already-computed performance attribution effects. Linking does not identify the investment decisions or establish manager skill. “Optimised” describes the adjustment of reporting coefficients; it does not mean minimising economic risk or choosing an optimal portfolio.
A report that fails to add up
Consider two fictional periods, with returns measured consistently and no external cash flows. Effects A and B are illustrative components, each expressed as a contribution to arithmetic active return.
Period
Portfolio
Benchmark
Effect A
Effect B
Active return
1
10%
5%
+3 pp
+2 pp
+5 pp
2
−5%
−2%
−1 pp
−2 pp
−3 pp
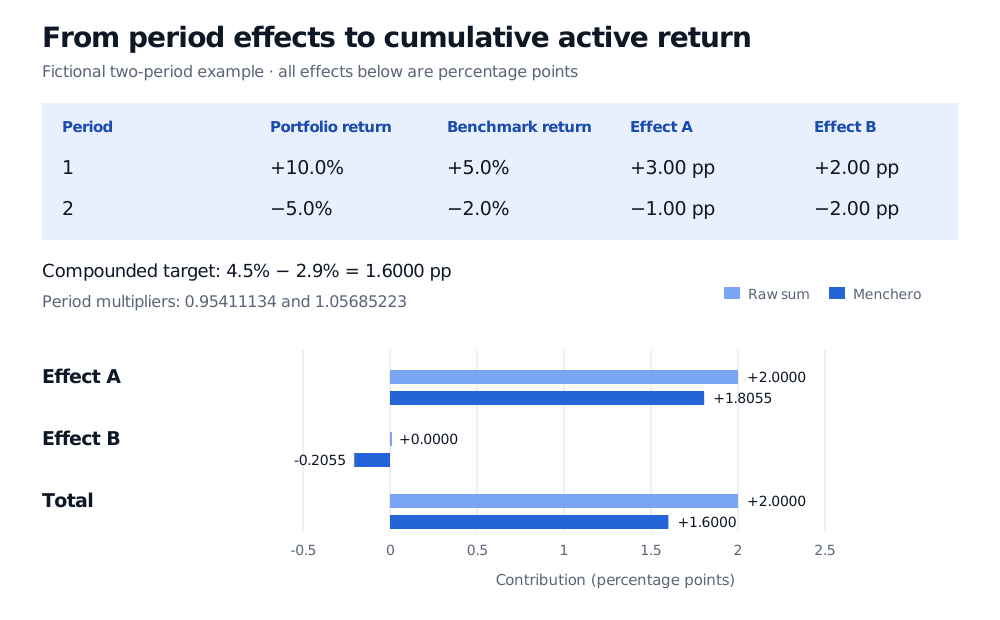
Each row reconciles. The columns summed through time give A = 2 percentage points and B = 0. Yet the portfolio compounds to 1.10(0.95)−1=4.5%, and the benchmark to 1.05(0.98)−1=2.9%. The cumulative arithmetic difference is 1.6 percentage points, rather than the 2 points from adding the period differences.
Scale first, then reconcile
Let rp,t,rb,t be decimal returns over n subperiods, and let ej,t be effect j, with ∑jej,t=dt=rp,t−rb,t. Define
These are the scale and correction equations in Menchero’s primary technical disclosure, with notation changed. Eagle’s documentation describes the same scale-then-correct procedure. The result satisfies ∑jEj=Δ whenever the input rows reconcile.
Why this correction? Put c=Δ−M∑tdt. Reconciliation requires ∑tatdt=c. Minimise 21∑tat2 subject to that constraint. The Lagrangian
L=21t∑at2−λ(t∑atdt−c)
gives at=λdt and hence λ=c/∑tdt2. This proves the stated minimum for fixed M and nonzero ∑tdt2. The objective concerns distance from the chosen common scale, not an effect’s volatility, statistical uncertainty or economic importance.
For the example, M≈1.01832439. Scaling the raw total alone would give 1.01832439(0.02)=0.02036649, leaving a required correction of about −0.436649 percentage points. The adjustments are a1≈−0.06421306 and a2≈0.03852783.
Linked contribution
Calculation in decimal returns
Percentage points
A
0.95411134(0.03)+1.05685223(−0.01)
+1.805482
B
0.95411134(0.02)+1.05685223(−0.02)
−0.205482
Total
A + B
+1.600000
Values use unrounded coefficients. Effect B’s raw sum was zero, but its positive and negative observations receive different multipliers. Its linked contribution can therefore be nonzero.
Fictional two-period example: raw A is 2 percentage points and B zero; Menchero gives A 1.8055 and B minus 0.2055, summing to the compounded difference of 1.6000 points.
Original fictional example. One multiplier per period applies to both effects; the linked total matches the difference between compounded returns.
Equal cumulative returns still need checking
When Rp=Rb=R, use the continuous limit
M=(1+R)(n−1)/n.
Do not automatically set at=0. Take portfolio returns of 10%, 10% and benchmark returns of 21%, 0%. Both compound to 21%, so Δ=0 and M=1.1. However, d1=−0.11, d2=0.10 and ∑tdt=−0.01. Leaving the adjustments at zero would report −1.1 percentage points, despite equal final returns. The correction numerator is 0−1.1(−0.01)=0.011, so the correction remains necessary. The resulting multipliers are about 1.04524887 and 1.14977376, and their weighted active returns sum to zero.
The separate case dt=0 in every period makes ∑tdt2=0. Then portfolio and benchmark paths coincide, reconciliation is already satisfied, and choose at=0. Individual effects can still offset each other within a period; they need not vanish.
For numerical work near cumulative equality, set x=(1+Rp)1/n and y=(1+Rb)1/n. The algebraically equivalent expression
M=n1k=0∑n−1xn−1−kyk
avoids subtracting nearly equal roots and includes the equality limit. Retain the correction and check the final residual. The displayed formula documentation in R-Finance’s implementation agrees with the general formula, but the inspected code sets the adjustment to zero whenever cumulative returns are equal. The counterexample above shows why that branch is insufficient.
Interpreting the linked result
Cariño linking uses different coefficients and can allocate the same reconciled total differently. Record the linking convention alongside the attribution model. Reconciliation alone does not make one explanation uniquely economically correct.
This is an arithmetic decomposition of Rp−Rb. Geometric attribution instead works with relative wealth, (1+Rp)/(1+Rb), and a different aggregation structure. Keep the benchmark, return basis, subperiod grid and treatment of costs consistent before comparing reports. The formulas here assume returns greater than −100%; a total-loss observation needs explicit treatment rather than blindly applying roots and limits.
For the return measurement underneath the calculation, see Risk-Adjusted Performance Measures, especially its time-weighted compounding section. The preview is public; the full lesson requires membership.
Sources
Jose G. Menchero (2000), An Optimized Approach to Linking Attribution Effects Over Time, The Journal of Performance Measurement, Fall, 5(1), pp. 36–42. The publisher’s abstract was accessible; the full paper is sold separately and was not read for this article.