Market fragmentation is the distribution of trading interest and executions in the same instrument across multiple trading venues. For a quant estimating an order's cost, it means that one venue's best price and size may describe only part of the market. Combining quotes can reveal more market depth, but executing against that depth requires access, routing and sufficiently current information.
A stock's listing venue need not be its only execution venue. Fragmentation can exist across displayed order books, as well as between displayed markets and venues offering hidden liquidity. It does not require persistent price disagreement: competing venues can have closely linked prices while maintaining separate orders and execution queues. The SEC's 2014 market-structure speech describes the division of equity order flow across venues; its venue counts and regulatory discussion describe that historical period.
A 250-share buy cannot fit in a 100-share quote
Consider fictional offers for the same stock, all in USD per share:
| Venue | Offer price | Displayed shares | Shares bought |
|---|---|---|---|
| A | 100.02 | 100 | 100 |
| B | 100.03 | 200 | 150 |
Assume the buyer can route to both venues, both offers are simultaneously valid, and the allocated shares remain executable until matching. Ignore fees, competing trades, cancellations and hidden orders. A buy for 250 shares takes 100 on A and 150 on B:
The consolidated displayed ask depth through 100.03 is 300 shares. At the best ask, 100.02, it is only 100 shares. Venue B has 50 shares remaining after the illustrated route.
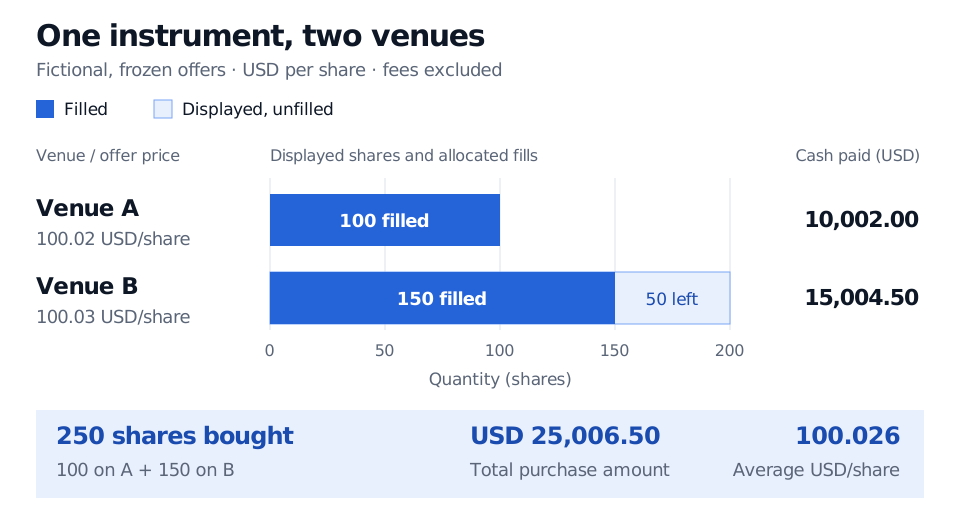
Original frozen two-venue example. Bars show displayed shares, with filled quantities in blue. Both venues are assumed accessible and all allocated shares executable before any competing update; fees and hidden liquidity are excluded.
Pricing all 250 shares at A's offer would understate this purchase amount by USD 1.50. More fundamentally, that quote supplies no evidence that the extra 150 shares can trade on A at any price. If A is the only accessible venue and these are the only observed offers, the snapshot prices just 100 shares; the remaining 150 are unpriced. A partial fill's cash amount divided by the original 250-share request is not a valid full-order average.
Smart order routing connects the execution decision across venues. A consolidated display connects the observations. These are separate capabilities: seeing B does not establish that the buyer can send an eligible order there.
Three boundaries around “available liquidity”
Displayed depth has a coverage boundary. Add sizes only for the same instrument, side, price range and compatible observation time. Two vendors reporting the same venue's order are two observations of one order, not twice the supply. Hidden interest is absent from a displayed-depth sum; its absence does not prove that no additional liquidity exists. The national best bid and offer is a US quote-consolidation concept, not a synonym for the full depth of every venue.
Accessible liquidity has a participant boundary. A feed may show venues that a particular broker cannot reach, or orders incompatible with the participant's permissions, instrument access or order instructions. Clearing arrangements and jurisdictional restrictions can also matter. In the example, 300 shares are displayed through 100.03, but A-only access supports just 100 observed shares. Access is specific to the trader and route.
Execution has a time boundary. Even an accessible offer can disappear before an order arrives. Quote receipt times, source timestamps, feed gaps and the travel time of child orders matter. A merged snapshot can combine A's old quote with B's newer quote even though those offers never coexisted. A research backtest must reconstruct the information available to its trading system at the decision time, then model subsequent arrival and fills. A historical consolidated book is not automatically an executable opportunity.
Trades, Quotes and Market State develops this distinction using event and receipt clocks, quote age and causal joins. It has a public preview; the full lesson requires membership.
Fragmentation changes the problem, not the verdict
The route above minimises the purchase amount against the specified frozen offers before fees. It does not establish the best live route. Transaction costs include more than quoted prices. For example, if A alone charges the buyer USD 0.002 per filled share, the illustrated allocation adds USD 0.20 in fees: its total becomes USD 25,006.70, or 100.0268 per share. That is an illustrative fee assumption, not a venue tariff. Delays, failed fills and information revealed by sending child orders can change the result again.
Nor does splitting trading across venues mechanically reduce total liquidity. Foucault and Menkveld's 2008 study found deeper consolidated displayed books after a competing venue entered the Dutch equity market. Their theory ties outcomes to routing participation, fees and queue competition. Their sample and market design do not establish a universal benefit; the authors also distinguish measured displayed depth from unobserved hidden depth.
Redundancy needs similar care. CNMV's February 2026 announcement of outage research reports that alternative venues remained technically available while overall liquidity deteriorated during primary-venue outages. Multiple places to trade need not provide independent sources of price information or resilient liquidity under stress.
For an execution study, compare outcomes at a fixed order size and stated access: fill rate, completion time, total cost and data coverage. Count venues to describe structure; measure the order's outcome to evaluate its consequences.
Sources
- SEC, Mary Jo White: “Enhancing Our Equity Market Structure”, 5 June 2014, “Enhancing Market Transparency and Examining Trading Venue Regulation” and “Mitigating Broker Conflicts.” Historical market-structure discussion, not a statement of current legal requirements.
- Thierry Foucault and Albert J. Menkveld: “Competition for Order Flow and Smart Order Routing Systems”, Journal of Finance 63(1), 2008, pp. 119–158. Introduction; §I.A.1–2 on depth and routing; §I.B.1–2 on competition; §II.A.2 on data limitations. Original published paper hosted as a research mirror.
- CNMV: publication announcement for “Market Fragmentation: A Cushion Against Exchange Outages?”, 27 February 2026, one-page summary of research by Hans Degryse, Björn Hagströmer and Niklas Landsberg. Used for the reported outage finding, not an independent replication of the underlying study.