Isolation forest ranks unusual observations by how quickly random splits isolate them. Follow a path-length score and distinguish anomaly ranking from fraud probability.
Isolation forest
An isolation forest is an unsupervised learning method that ranks observations by how few random splits are needed to separate them from other observations. Shorter average paths indicate greater unusualness. In a quant pipeline, that can help prioritise suspicious ticks or unusual execution records for investigation, without needing a labelled example of every possible fault.
Separate the observation, rather than predict its label
Each isolation tree repeatedly chooses a feature at random and draws a split uniformly between that feature’s minimum and maximum in the current node. Trees use subsamples of the training data. An observation separated near the root has a short path; one embedded among similar observations usually requires more splits. Average across trees to reduce dependence on any single random partition.
If a tree stops with several training observations in a leaf, its path length includes an estimated remaining-depth correction. Thus the scoring input is not always just the visible leaf depth. See the original paper, §§2 and 4.2.
The distinction from a supervised random forest matters: isolation trees do not choose their thresholds to minimise prediction error against a response label.
A supplied path is enough to understand the score
Write hˉ(x) for the mean corrected path length and ψ>1 for the number of training observations sampled per tree. The original score convention is
Larger scores mean more anomalous observations; hˉ(x)=c(ψ) gives s=0.5. This is a normalisation reference, rather than a universal business decision threshold.
For an illustrative calculation, suppose ψ=8 and two observations have supplied mean corrected path lengths of 5 and 2. These are assumptions, not results from a fitted forest. Using the exact harmonic sum,
c(8)=140481≈3.435714,
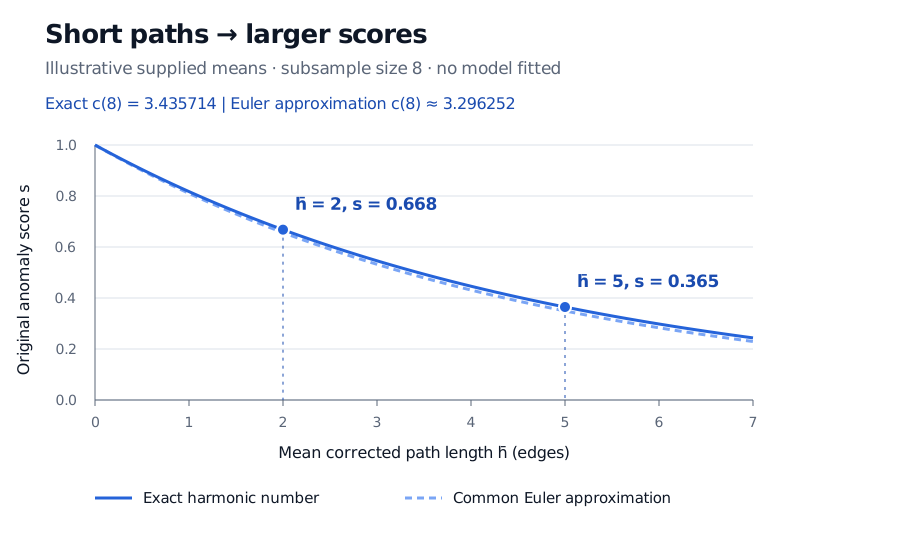
so the longer path gives 2−5/c(8)≈0.364679, while the shorter path gives 2−2/c(8)≈0.667981. The second observation ranks as more unusual under this convention. It does not have a 66.8% probability of fraud.
The commonly used approximation Hm≈ln(m)+γ, where γ is Euler’s constant, instead gives c(8)≈3.296252. At this small subsample size the numerical difference is visible. Keep the normalisation convention fixed when reproducing scores; the worked values here use the exact sum.
At subsample size 8, supplied mean corrected path lengths 2 and 5 give exact-harmonic anomaly scores 0.668 and 0.365. The score decreases with path length. A dashed curve uses the Euler approximation; no forest was fitted.
Original analytic illustration using supplied path lengths. Solid blue uses the exact harmonic number; the dashed line uses its common Euler approximation. Neither curve is an empirical fit or a probability of fraud.
Check which way the software score points
The scikit-learn API uses the opposite sign for score_samples: lower values are more abnormal. Its decision_function subtracts offset_ from score_samples; negative decision values flag outliers. With contamination='auto', the offset is −0.5. A numeric contamination setting selects a training-score threshold; it does not estimate the actual fraud rate. The exact-harmonic illustration above is not a claim about outputs from a particular software fit.
What the flag leaves unresolved
An outlier is unusual relative to its comparison data. The distinction between screening a possibly contaminated training set and scoring new observations against a clean reference set is explained in the novelty and outlier detection guide. Neither setup establishes the economic meaning of a flag.
For example, unusually large trade sizes could be ordinary for a different venue or order type. A new volatility regime could also produce many flags from a model trained on quiet periods. Check the reference period and feature definitions before interpreting a ranking. For historical monitoring, fitting on future observations would change the reference population using information unavailable at the time.
A surveillance decision needs separate evidence about errors, legitimate rare events and investigation costs. Isolation scores alone establish neither fraud nor a profitable trading signal. For a contrasting mechanism, the SelfMadeQuant anomaly-detection lesson develops Gaussian-mixture density thresholds and false-alarm trade-offs; the preview is public and the full lesson requires membership.