Institutional holdings data records delayed manager positions. Separate share changes from repricing, respect filing availability and amendments, and define the reported universe.
Institutional holdings data
Institutional holdings data records securities positions attributed to investment managers or institutions at specified reporting dates. Quants use it to study manager overlap, position changes and concentration. The central challenge is that a delayed position snapshot is neither a live portfolio nor a record of the trades that produced it.
A familiar US source is Form 13F. Other disclosures and commercial products have different populations and reporting rules; “institutional holdings” is a dataset category, not a promise that every institution and asset is covered.
What a 13F snapshot actually covers
As checked on 1 November 2026, the SEC's Form 13F instructions apply the USD100 million threshold to Section 13(f) securities under investment discretion, measured on the last trading day of any month in a calendar year. Meeting it triggers a year-end report and reports for the first three quarters of the following year, normally due within 45 days of each period-end; calendar adjustments can extend the date. It is not a threshold for total firm assets or an issuer ownership percentage.
The SEC's current FAQs explain that reportable securities come from the Official List, primarily US exchange-traded equities with some other instruments. Short positions and written options are excluded; held reportable options can appear. Open-end mutual-fund shares are excluded. Confidential treatment can delay disclosure of particular holdings. A public report therefore cannot establish a manager's net exposure across the whole portfolio.
A manager can exercise discretion over several client accounts. Shared-discretion and other-manager reporting also matter when combining filings. One filing is not an inventory of all institutions' ownership. Schedules 13D and 13G are separate beneficial-ownership reports, with different definitions and triggers; they are not interchangeable 13F observations.
Value growth is not share growth
Take a fictional manager and one common-share class, with no splits, transfers or changes in reporting scope. Money is USD. These are simplified position records, not a complete filing.
Reporting date
Shares
Quarter-end price per share
Position value
31 March 2026
100
20
2,000
30 June 2026
120
25
3,000
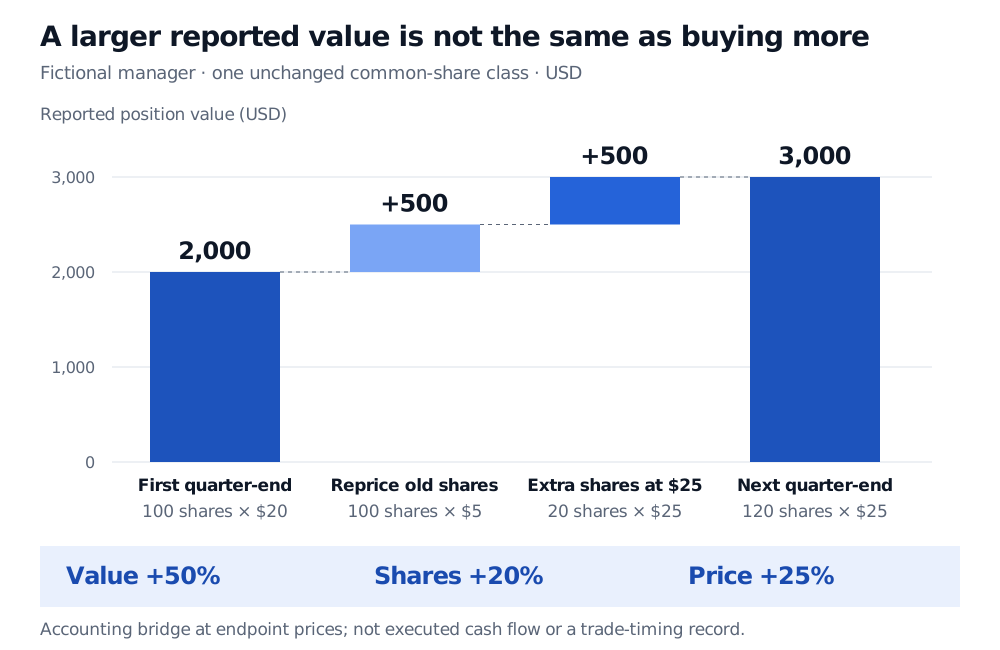
The position value rises by 50%, but the share count rises by only 20%. The price rises by 25%. The connection is multiplicative:
2,0003,000=100120×2025=1.20×1.25=1.50.
Calling the value increase “50% more buying” confuses repricing with a change in quantity. An exact endpoint accounting bridge is
The first USD500 reprices the original 100 shares. The second USD500 values the additional 20 shares at the later price. This convention assigns the price–quantity interaction to the share-change term. It does not say the manager spent USD500: the filings reveal neither the prices paid nor the path of transactions within the quarter. A manager could buy and sell repeatedly between the two snapshots.
Fictional reported position value rises from USD2,000 to USD3,000: USD500 reprices 100 existing shares and USD500 values 20 additional shares at USD25. Value growth is 50%, share growth 20%, and price growth 25%.
Original fictional endpoint decomposition. Blue steps explain the USD1,000 value increase; they are not transaction cash flows. The security and reporting scope are held fixed.
Even the 20% share increase needs interpretation in real data. Splits, mergers, identifier changes, account transfers and amended reports can change a recorded count without the buying story suggested by a raw difference. Compare like-for-like securities and reporting entities before labelling a feature “manager accumulation.”
Two clocks, plus the filing version
Suppose the fictional March report first becomes public on 12 May 2026 at 16:00 UTC, and the June report on 10 August 2026 at 16:00 UTC. Assume the research process can use each report immediately at that time. These are stipulated availability times, not filing deadlines.
On 15 July, the latest disclosed count in this example is still 100 shares, describing March. The 120-share June observation is unavailable. Assigning it to a July decision because its reporting date is June creates look-ahead bias. On 11 August, it is eligible—but remains a June snapshot, not proof of the manager's August holdings. If a vendor or internal process receives it later, use that later usable time.
Preserve the original filing and each amendment with its own availability time. The SEC distinguishes amendments that restate a report from amendments that add holdings; the latter supplement rather than replace the original. Replacing every historical report with today's final amended version gives earlier decisions information they did not have. The owned Point-in-Time Data lesson develops the version-selection rule and audit checks; its preview is public and the full lesson requires membership.
Turn filings into a defined research variable
A useful record retains the manager identifier, reporting period, security identifier and class, share or principal-amount units, reported value and its units, option flag, discretion fields, filing identifier, amendment type and usable timestamp. A ticker alone is an unreliable join key. Historical value-unit conventions also need checking before combining vintages.
Then define the population and denominator. “Number of reporting managers holding this security” is a count within the observed filing universe. “Reported ownership fraction” additionally needs a compatible shares-outstanding denominator at the same economic date. “Weight in the reported 13F portfolio” uses reported positions as its denominator, not the manager's entire wealth or risk budget. Missing positions need a reason: nonreportable, withheld, omitted or not yet available is different from a verified zero.
The SEC's downloadable 13F datasets flatten as-filed XML for analysis. The SEC warns that they omit some filing metadata and may contain filing or extraction errors. Its historical refreshes also show why a downloaded file's vintage belongs in the research record. Reconcile important rows to the underlying filing rather than treating a convenient table as a complete, immutable ownership history.
Manager-overlap or holdings-change features can support a research hypothesis. Whether they forecast returns after disclosure is an empirical question requiring an available-at-the-time universe and feasible subsequent trading. The snapshot alone supplies neither the transaction path within the quarter nor evidence that following the manager is profitable.
Sources
SEC: Form 13F and current instructions, General Instructions 1–4, Confidential Treatment Instructions, and Special Instructions 3 and 5–11. Reporting trigger, coverage, discretion, amendments and field definitions.
SEC: Frequently Asked Questions About Form 13F, Question 25 updated 6 March 2026; page last reviewed 28 September 2026. Questions 2, 7–8, 25, 40–43 and 58b–58d. Staff guidance, distinct from the rules themselves; checked 1 November 2026.
SEC: Form 13F Data Sets, dataset description, limitations and refresh notes; page updated 31 August 2026.