Choose the mean from the exposure: harmonic for equal-cash purchase prices, geometric for compounded gross returns, with explicit positive inputs and weights.
Harmonic and geometric mean
The harmonic mean averages reciprocals and then takes the reciprocal; the geometric mean averages logarithms and then exponentiates. They answer different financial questions: the harmonic mean gives average purchase cost when equal cash amounts buy at different positive prices, while the geometric mean gives the constant growth factor that reproduces compounded returns. Choose the quantity being preserved before choosing the mean.
For n≥1 strictly positive observations x1,…,xn, the three familiar means are
Here A is the ordinary arithmetic sample mean. These definitions use equal weights; the positive domain makes both the reciprocals and real logarithms well defined. NIST's treatment of means gives the definitions and their weighted generalisation.
A zero average percentage return can still lose money
Consider a fictional investment earning +20% and then −20% over two equal-length periods. Start with a wealth index of 100, retain all income and assume no external cash flows, fees or taxes. Its gross return factors are 1.20 and 0.80:
100×1.20×0.80=96.
The arithmetic mean simple return is zero, but compounding produces a 4% total loss. The constant per-period simple return g must solve 100(1+g)2=96, so
1+g=1.20×0.80≈0.979795897,g≈−2.0204103%.
The geometric mean is taken over gross factors 1+ri, followed by subtracting one. Taking a geometric mean directly over signed percentage returns does not reproduce this wealth calculation. The return calculations in Eric Zivot's university notes distinguish products of gross returns from sums of simple returns.
For the same two gross factors, A=1, G≈0.979795897 and H=0.96. That harmonic mean happens to equal the two-period product in this example, but it is not the equivalent per-period growth factor: repeating 0.96 twice ends at 92.16, rather than 96.
With n equal periods, the equivalent compound return is G(1+r1,…,1+rn)−1. When each period is one year, this is the observed compound annual growth rate. Unequal observation intervals require an explicit time unit: the annual equivalent uses the product of the factors raised to the reciprocal of total elapsed years, rather than automatically taking an nth root.
Equal cash purchases ask a different question
Buy the same fictional share at two prices, USD 100 and USD 200 per share. Ignore fees and allow fractional shares. Spend USD 100 at each purchase:
Purchase
Price per share
Cash spent
Shares acquired
First
USD 100
USD 100
1
Second
USD 200
USD 100
0.5
Total
—
USD 200
1.5
The average cost per share is total cash divided by total shares:
1.5200=1/100+1/2002=H(100,200)≈USD 133.33.
The lower-price purchase buys more shares, which is why simply averaging the two prices gives the wrong cost for this ledger. Buying one share at each price instead costs USD 300 for two shares, making the arithmetic average USD 150 correct for that different exposure. Neither figure is a forecast of the next price or evidence that either purchase policy will outperform.
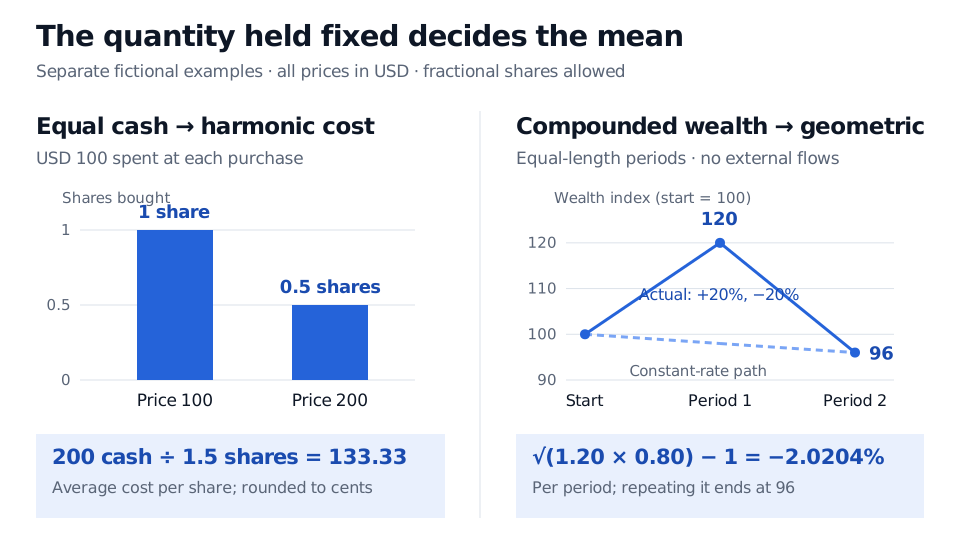
Separate fictional examples: equal USD 100 purchases at prices 100 and 200 buy 1 and 0.5 shares, giving average cost USD 133.33 per share. A wealth index earning plus 20% then minus 20% follows 100, 120, 96; constant geometric growth of minus 2.0204% per period reaches the same 96.
Original fictional examples. Left: equal cash fixes the numerator of price and varies shares bought. Right: solid blue shows observed period-end wealth; dashed blue shows the equivalent constant-rate path. Connecting lines do not describe within-period trading.
Weights and the positive domain are part of the definition
For nonnegative weights wi summing to one, retain strictly positive xi wherever wi>0. Omit zero-weight observations. Then
It is a cash-weighted harmonic mean of prices and a share-weighted arithmetic mean of prices. The weights change with the representation. “Use a harmonic mean for ratios” is incomplete advice: first identify the numerator, denominator and exposure being aggregated.
For positive observations and the same weights, the arithmetic–geometric–harmonic ordering is
Hw≤Gw≤Aw.
Equality throughout holds precisely when all observations with positive weight are equal. The concavity of the logarithm gives ∑iwilogxi≤logAw through Jensen's inequality, hence Gw≤Aw. Applying the same argument to 1/xi gives Hw≤Gw. Boyd and Vandenberghe develop this Jensen and AM–GM connection, §§3.1.8–3.1.9.
A zero observation makes the reciprocal and finite-log formulas unusable as written. For nonnegative data, a zero can be handled through an explicitly stated limiting convention for G or H; it must not be silently dropped. In a no-flow investment, a zero gross factor means complete loss, with no finite log return. Negative observations generally invalidate this real-log framework and the stated ordering, even if a particular product has a real root. Signed rates, short positions and negative wealth therefore need separately defined accounting rather than these formulas applied mechanically.
Finally, the ordering compares summaries of a specified dataset. It does not establish that the lowest mean is the most prudent forecast or that the highest is the correct expected return. Backtest Evaluation connects linked growth to cash-flow treatment, costs and risk. Its preview is public; the full lesson requires membership.
Practice: identify the weights
A fictional investor spends USD 120 at USD 40 per share and USD 240 at USD 80 per share, with no fees and fractional shares allowed. What is the average cost per share, and why does the unweighted harmonic mean fail?
Answer. Each purchase buys three shares, so the average cost is 360/6=USD 60. The cash weights are 1/3 and 2/3, giving the weighted harmonic mean [(1/3)/40+(2/3)/80]−1=60. The unweighted harmonic mean is approximately USD 53.33; it would describe equal cash amounts at the two prices. Here the arithmetic mean of the two prices works because the share quantities are equal.
Eric Zivot, Return Calculations, updated 24 June 2014: §1.2.1, especially equation 1.9 for multiperiod gross returns; pp. 14–15 for equivalent annual rates; §1.2.2 for log returns. The examples here are original fictional ledgers and paths.