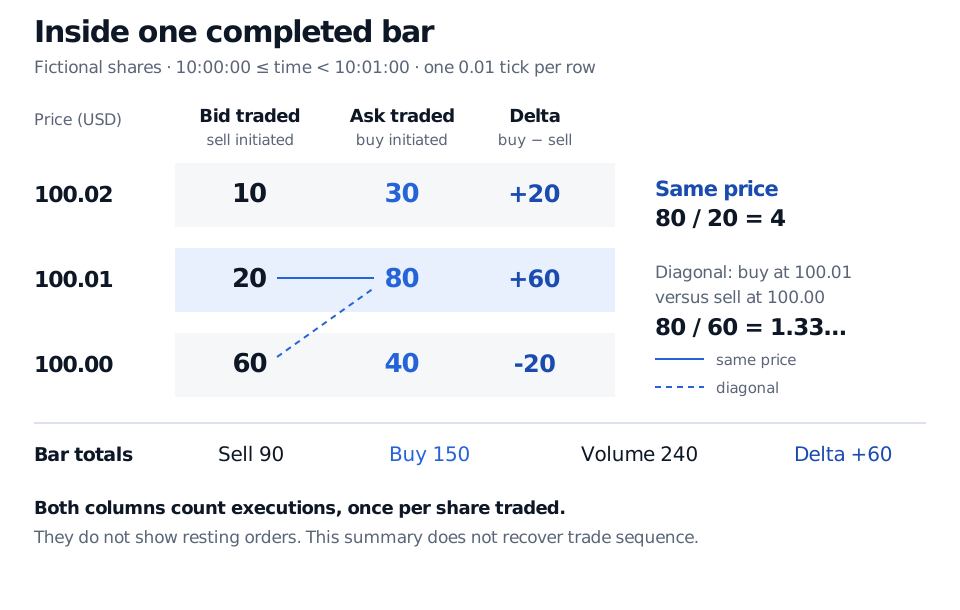
A price-by-price display of traded buy and sell volume within each bar, with explicit sign, row-size and imbalance conventions.
Footprint chart
A footprint chart displays traded volume at each price within each chart bar, often split into seller-initiated and buyer-initiated quantities. It preserves the price location of signed order flow: a bar with positive total delta can still contain prices dominated by aggressive selling. That distinction helps a quant inspect where an aggregate execution-flow feature came from.
Read the two numbers as executions
In the convention used here, each row reads bid-traded volume × ask-traded volume. The left number counts shares sold into bids; the right counts shares bought from offers. Every execution has both a buyer and a seller. The split describes which side initiated, not a count of people or an absence of counterparties. Marketable limit orders can initiate executions too.
These are completed transactions, not quantities waiting in the limit order book. A displayed bid can be cancelled without generating any footprint volume. Sierra Chart's Numbers Bars definitions distinguish bid/ask traded quantity from trade counts and define delta as ask volume minus bid volume.
One bar, three different local balances
Assume a fictional stock with a USD 0.01 tick. Use one tick per price row and one completed minute, 10:00:00 inclusive to 10:01:00 exclusive in the exchange's local time. All included executions have known aggressor sides; quantities are shares, and each execution's quantity enters exactly one column.
Execution price (USD)
Bid traded: sell initiated
Ask traded: buy initiated
Delta: buy − sell
100.02
10
30
+20
100.01
20
80
+60
100.00
60
40
−20
Bar total
90
150
+60
Total volume is 90+150=240 shares, while bar delta is 150−90=60 shares. Summing the row deltas gives the same result: 20+60−20=60. The 100.00 row contributes selling pressure under this convention even though the whole bar is positive. Cumulative volume delta would add the bar's +60 to a running total; the footprint retains its distribution across prices.
Fictional completed one-minute footprint: at USD 100.02 sell/buy shares are 10/30, at 100.01 they are 20/80, and at 100.00 they are 60/40. Bar volume is 240 and delta is +60 shares. Connectors distinguish 80/20 at the same price from 80/60 diagonally.
The solid connector compares quantities at 100.01; the dashed connector compares buying at 100.01 with selling one tick lower. Both use the same footprint.
Same-price and diagonal ratios answer different questions
A same-price comparison at 100.01 is 80/20=4: four buyer-initiated shares per seller-initiated share at that price over the bar. Bid and ask executions at the same price need not have occurred at the same instant; quotes can move during the minute.
Choose a diagonal buying comparison as ask-traded volume at price p divided by bid-traded volume one row below. At 100.01 this is 80/60=4/3, approximately 1.33. The denominator changed, so the ratio changed. A corresponding diagonal selling comparison uses bid-traded volume at p against ask-traded volume one row above. Sierra Chart documents separate same-price and diagonal comparison methods.
A color threshold is a chart setting, not a universal boundary between ordinary trading and meaningful imbalance. State its direction, minimum-volume filter and comparison rule. Here a zero or missing denominator means ratio unavailable, including zero divided by zero. Do not silently substitute one or label missing data as zero. Sierra Chart offers a configurable zero-as-one option, so screenshots with different settings need not agree.
Establish what the feed actually measures
An exchange flag and an estimated sign are different evidence. CME's Trade Summary specification defines aggressor side as buy, sell or no aggressor. A no-aggressor execution needs an explicit unclassified category or exclusion policy; it should not be forced into a buy/sell column without disclosure.
The label “footprint” alone does not establish that exchange aggressor flags were used. TradingView's calculation documentation describes assigning buy/sell volume from intrabar price direction, with historical granularity depending on available lower-interval data. Such columns are estimates, not verified bid-hit/ask-lift executions. Record the vendor, venue coverage, sign method, treatment of corrections and unknown signs, and whether the history is tick data or coarser approximations.
Row size and bar boundaries also change the result. Combining the example's 100.00 and 100.01 rows produces sell volume 80 and buy volume 120: the merged same-row ratio is 1.5, hiding the original ratios. Record the tick multiplier, bin origin, timeframe or activity-bar rule, timezone and session boundaries. Feed gaps are missing observations.
Finally, the footprint is an aggregation. Reordering executions within this minute can leave every displayed number unchanged. These totals cannot recover the opening/closing trade sequence, identify an institution or establish passive replenishment. Heavy buying without further price appreciation may motivate an absorption hypothesis, but checking it needs event-level quotes and executions. Neither a highlighted row nor positive delta establishes future support or profit.
For the measurement behind these columns, Order Flow and Adverse Selection develops trade classification, signed-volume features and their interpretation; the full lesson requires membership.
Sources
Sierra Chart — Numbers Bars: definitions, same-price versus diagonal comparisons, and configurable handling of zero denominators.